One platform, many ways to boost your operation

From simple monitoring to machine learning, dbsnoop grows with you. Explore the features and learn more.

Generative AI

  • Text-To-SQL
    Ask in natural language, receive a ready-made query. It’s that simple. The AI translates your question into optimized SQL, even if you don’t master the language.


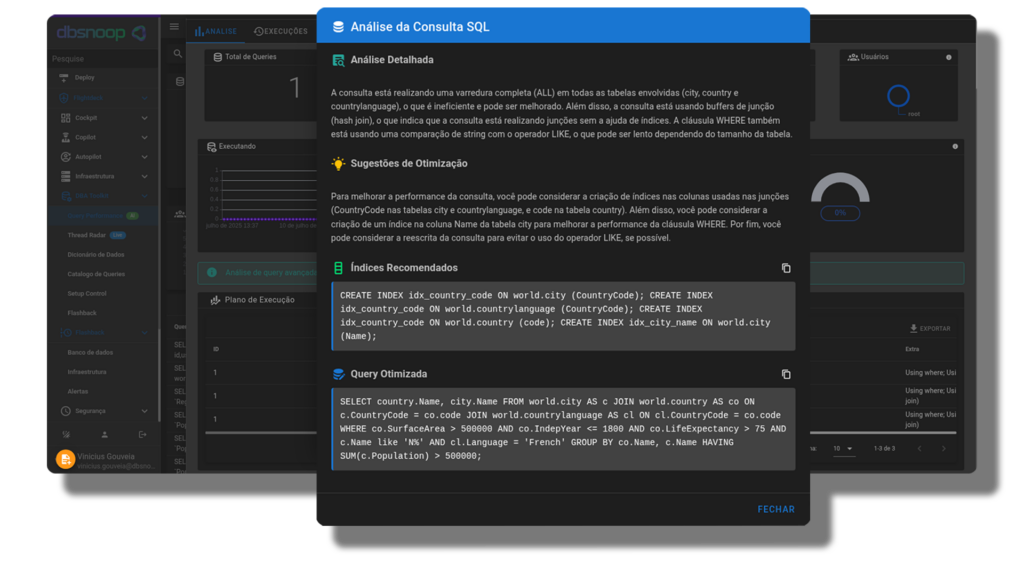
  • Query Fine Tuning
    Discover what’s slowing down your application and fix it in seconds. The AI analyzes, suggests, and delivers ready-to-use commands. Performance without guesswork.


  • LGPD Compliance
    Monitor your database with complete security. Intelligent data collection without exposing sensitive information. Guaranteed LGPD compliance, effortlessly.

Cockpit

  • Situational Awareness

  • Alert Panel (Master Warning)

  • Silent Horn (acknowledge)

  • Alert acknowledgment logging

  • Availability Trail

  • Insights Hub

  • Services and Servers Inventory

  • Technical Capacity

  • Critical Files Audit

  • Traffic Audit

  • Domain Authority

  • URL Down Detector

  • SQL Database Monitoring (MySQL, MariaDB, PostgreSQL, Oracle, DB2, SQL Server)

  • NoSQL Database Monitoring (MongoDB, Redis, Neo4J, Cassandra)

  • Monitoring of APIs, Websites, Applications

Copilot

  • Virtual DBA with performance and security improvement advisors for OS and database

  • Database and query performance analysis

  • Query Flight Deck and improvement advisors

  • Query catalog and tracking of first view, behavior, and last view

  • Health Check – Environment status analysis, impact visualization, and bottleneck detection

  • Assessment and Capacity Plan – AI-based consulting to suggest improvements (available for certain technologies)

  • Behavior Analysis – Review everything that happened in the database for RCA (Root Cause Analysis)

  • Security Audit – Audit of users, behavior, privileges, patches, and hotfixes

  • Capacity trends

Infrastructure | Autopilot

  • Network Map

  • Hardware, Virtual Machine, and Cloud Monitoring

  • Real-time monitoring

  • Interaction with the Operating System (available for certain technologies)

  • Storage Overview

  • Scheduling of commands, scripts, and maintenance during off-hours, with alerts if something goes wrong

  • BRO (Business Rules Observability) – Collect, process, monitor, alert, and store metrics (KPIs) on business rules

  • Create your own choreographies, enabling monitoring and observation of any item that provides telemetry

  • Logs

DBA Toolkit | Flashback

  • Query Performance

  • Query Catalog

  • Data Dictionary

  • Thread Radar – Enables real-time observation and interaction with the monitored technology (database or OS)

  • Flashback

  • Index Review – Observes and suggests index improvements (available for some technologies)

  • Metadata Schema Change – Management of database modeling

  • Database, Infrastructure, Alerts

  • Observe everything that has happened in the database, past and present, to understand behaviors and locate faults

  • Available for operating systems, cloud, and databases

Virtual NOC

  • Audiovisual notifications on screen (computer/TV)

  • Intelligent one-way notifications via email

  • Auto-Dispatch (notification delivery with technician acknowledgment via WhatsApp, Telegram, Slack, Gchat)

  • Integration with Zabbix

  • Integration with TMS

  • Alerts via Telegram, WhatsApp, Slack, Email

Key Metrics and Telemetries

  • Operating System: CPU, Memory, Swap, I/O, Network, Disks, Connections, important file changes, user creation/removal


  • Databases: Connections, Locks, Deadlocks, configuration changes, queries, users, memory, CPU, indexes, foreign keys, buffers, and caches

Monitored Technologies

The complete tool for your team

Talk to a specialist and find out how we can meet your needs.

THE COMPLETE TOOL FOR YOUR TEAM

Talk to a specialist and find out how we can meet your needs.

MONITOR YOUR ASSETS WITH FLIGHTDECK

NO INSTALL – 100% SAAS

Complete the form below to proceed

*Mandatory