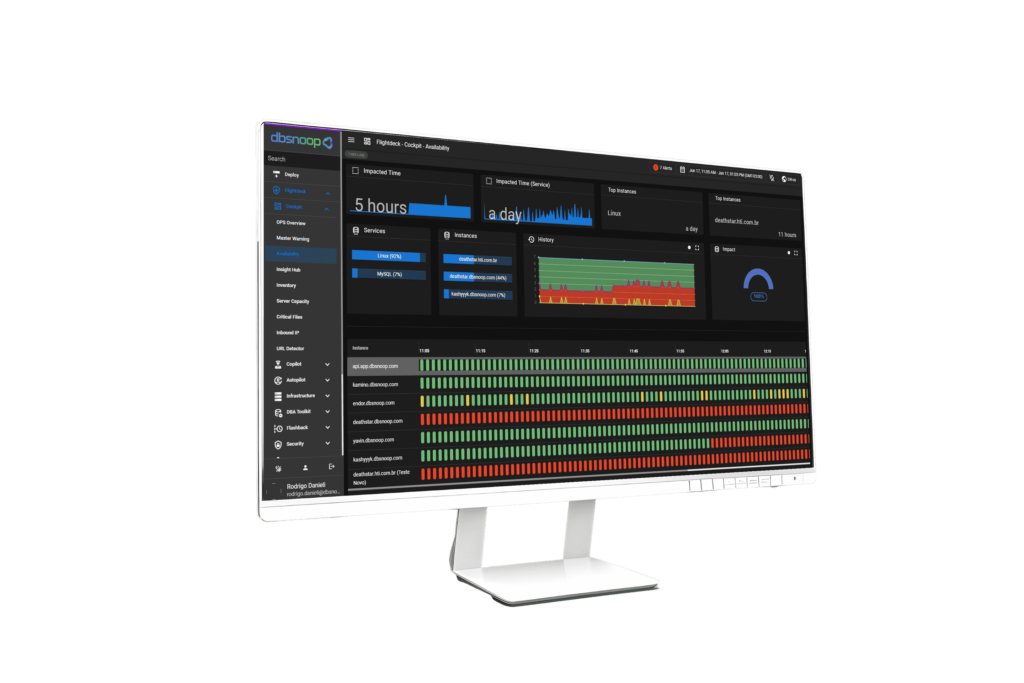
DBSNOOP VS GRAFANA: POWERFUL TOOLS FOR DATABASE OBSERVABILITY
Maximize the Performance of Your Database with AI-Driven Insights.
Simplify Your Database Observability with dbsnOOp
Discover how dbsnOOp outperforms Grafana in database monitoring, offering specialized features, integrated artificial intelligence, and a transparent pricing model starting from USD$ 60 per database instance.
Why Choose dbsnOOp?
- Specialized Focus on Databases
- Integrated Artificial Intelligence
- Advanced Features for Compliance and Security
- Simple and Affordable Pricing Model

Quick Comparison: dbsnOOp vs. Grafana
| Functionality | dbsnOOp | Grafana |
|---|---|---|
| Primary Focus | Specialized observability for databases | General data visualization and monitoring |
| Integrated Artificial Intelligence | Yes | No native (requires integrations) |
| Query Catalog | Yes | No (requires additional tools) |
| Metadata Management | Yes (includes LGPD compliance) | Limited (depends on plugins) |
| Flashback for RCA | Yes | Not available |
| Automated Health Check | Yes | Requires manual setup |
| Resource Inventory | Yes (databases and storage) | Limited |
| Thread Live Management | Yes (real-time monitoring and control) | Not supported |
| Command Scheduling | Yes (native) | Requires external integrations |
| Cost | USD 50 per instance | Variable and potentially unpredictable |
Highlighted Features of dbsnOOp
 Query Catalog
- Catalogs all executed queries.
- Facilitates the identification of performance degradation over time.
- Detects issues related to new queries after updates.
 Metadata Management
- Displays all database metadata.
- Identifies LGPD-protected fields to ensure compliance.
- Database versioning and comparison.
- Generates scripts for database standardization.
 Flashback and RCA
- Allows time travel to analyze the database and server state.
- Facilitates Root Cause Analysis (RCA) of issues.
 Integrated Artificial Intelligence
- Predictive analytics for performance optimization.
- Smart alerts with proactive recommendations.
🛡 Automated Health Check
- Compliance and capacity reports for the database.
- Continuous monitoring of system health.
🗒 Complete Inventory
- Details on database technology, vCPU, memory, and disk.
- List of all disks and storage consumption.
⚙️ Thread Live Management
- Real-time monitoring of all threads and connections.
- Ability to terminate problematic connections or queries.
⏱ Command Scheduling
- Native scheduling of commands and scripts.
- Execution on one or multiple database servers.
Transparent Pricing Model
dbsnOOp Flightdeck: USD $65 per Database Instance
- No Surprises: Fixed and predictable cost.
- High ROI: Advanced features at an affordable price.
- Economic Scalability: Add more instances without financial concerns.

Grafana: Variable and Unpredictable Costs
- Complex Pricing Model: Depends on users, plugins, and support.
- Estimated Monthly Costs:
- PostgreSQL/MySQL: USD 200 to USD 500+
- SQL Server: Can exceed USD 500
- Potential Hidden Costs: Additional licenses and required integrations.

Testimonials from satisfied Customers
"dbsnOOp has transformed the way we monitor our databases. The integrated artificial intelligence has provided us with insights we never had before."
João Silva
Diretor de TI
Ready to Revolutionize Your Database Observability?
Try dbsnOOp Flightdeck Today!
FAQ
Which databases does dbsnOOp support?
dbsnOOp provides dedicated support for major database management systems, including PostgreSQL, MySQL, and SQL Server, among others.
How does dbsnOOp’s artificial intelligence benefit my organization?
The integrated AI offers predictive analytics, performance optimization, and smart alerts, helping to anticipate issues and improve operational efficiency.
How does dbsnOOp’s pricing model work?
Simply pay USD 50 per database instance. No hidden costs or additional fees, allowing for accurate financial planning.


 Query Catalog
 Metadata Management
 Flashback and RCA
 Integrated Artificial Intelligence