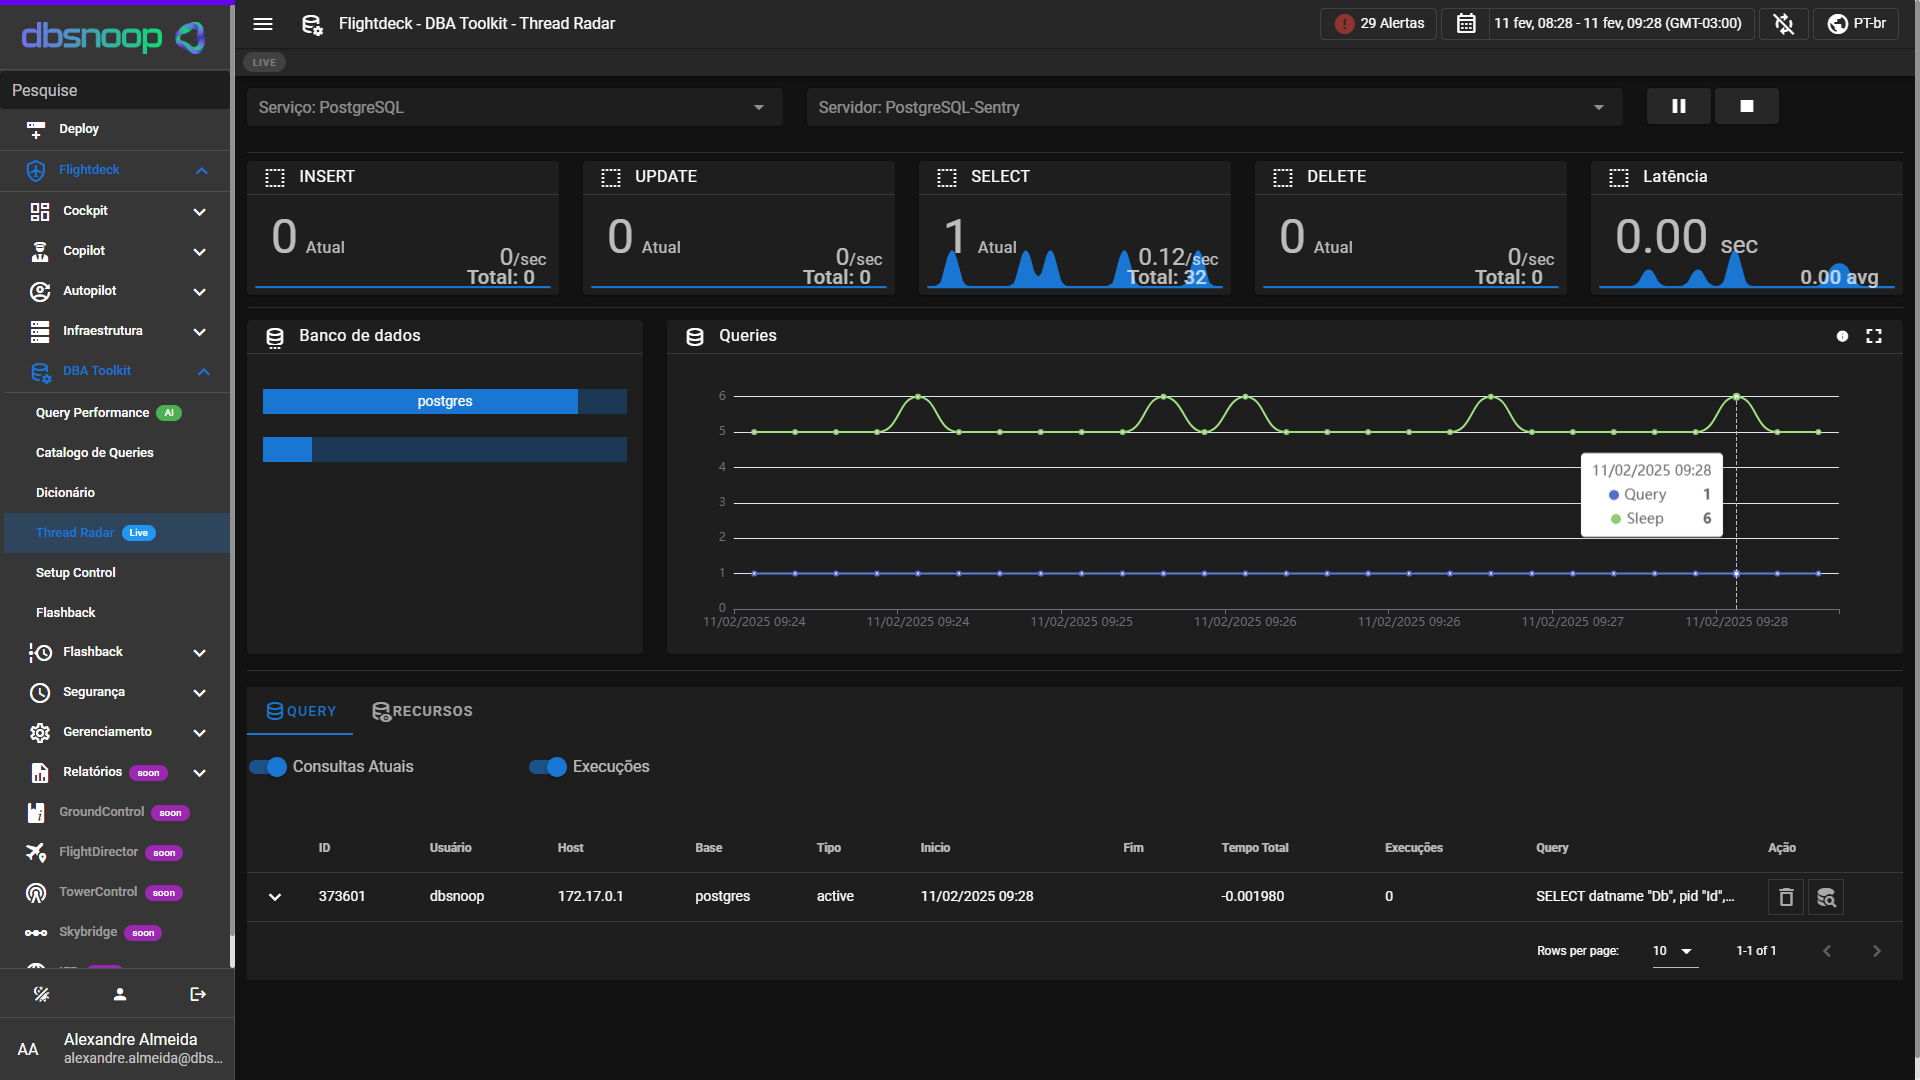
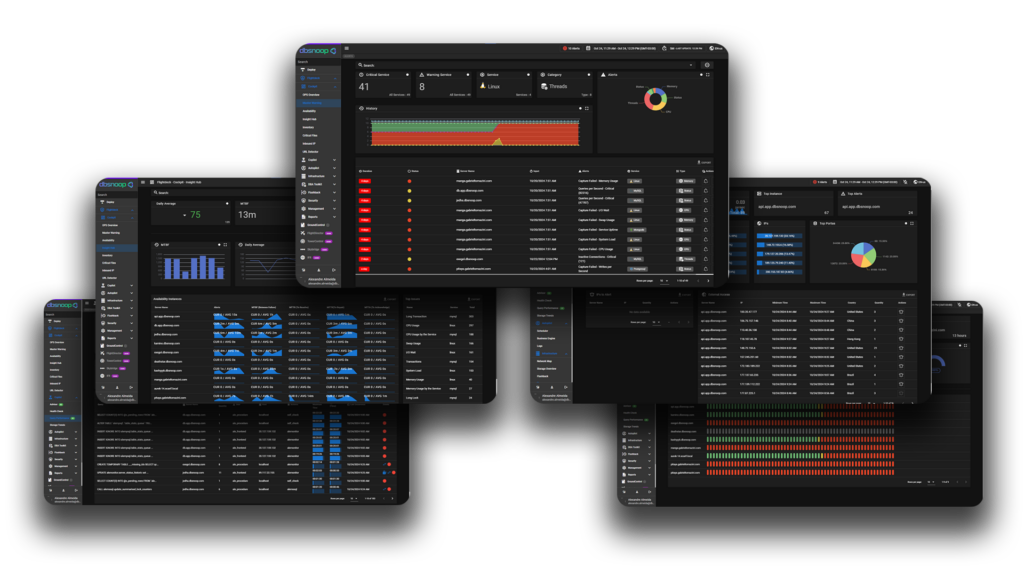
The dbsnOOp Monitoring and Observability module provides full, real-time visibility into the behavior of the database, infrastructure, and critical services. More than just alerting, it explains what is happening, why it is happening, and what could happen if nothing is done.
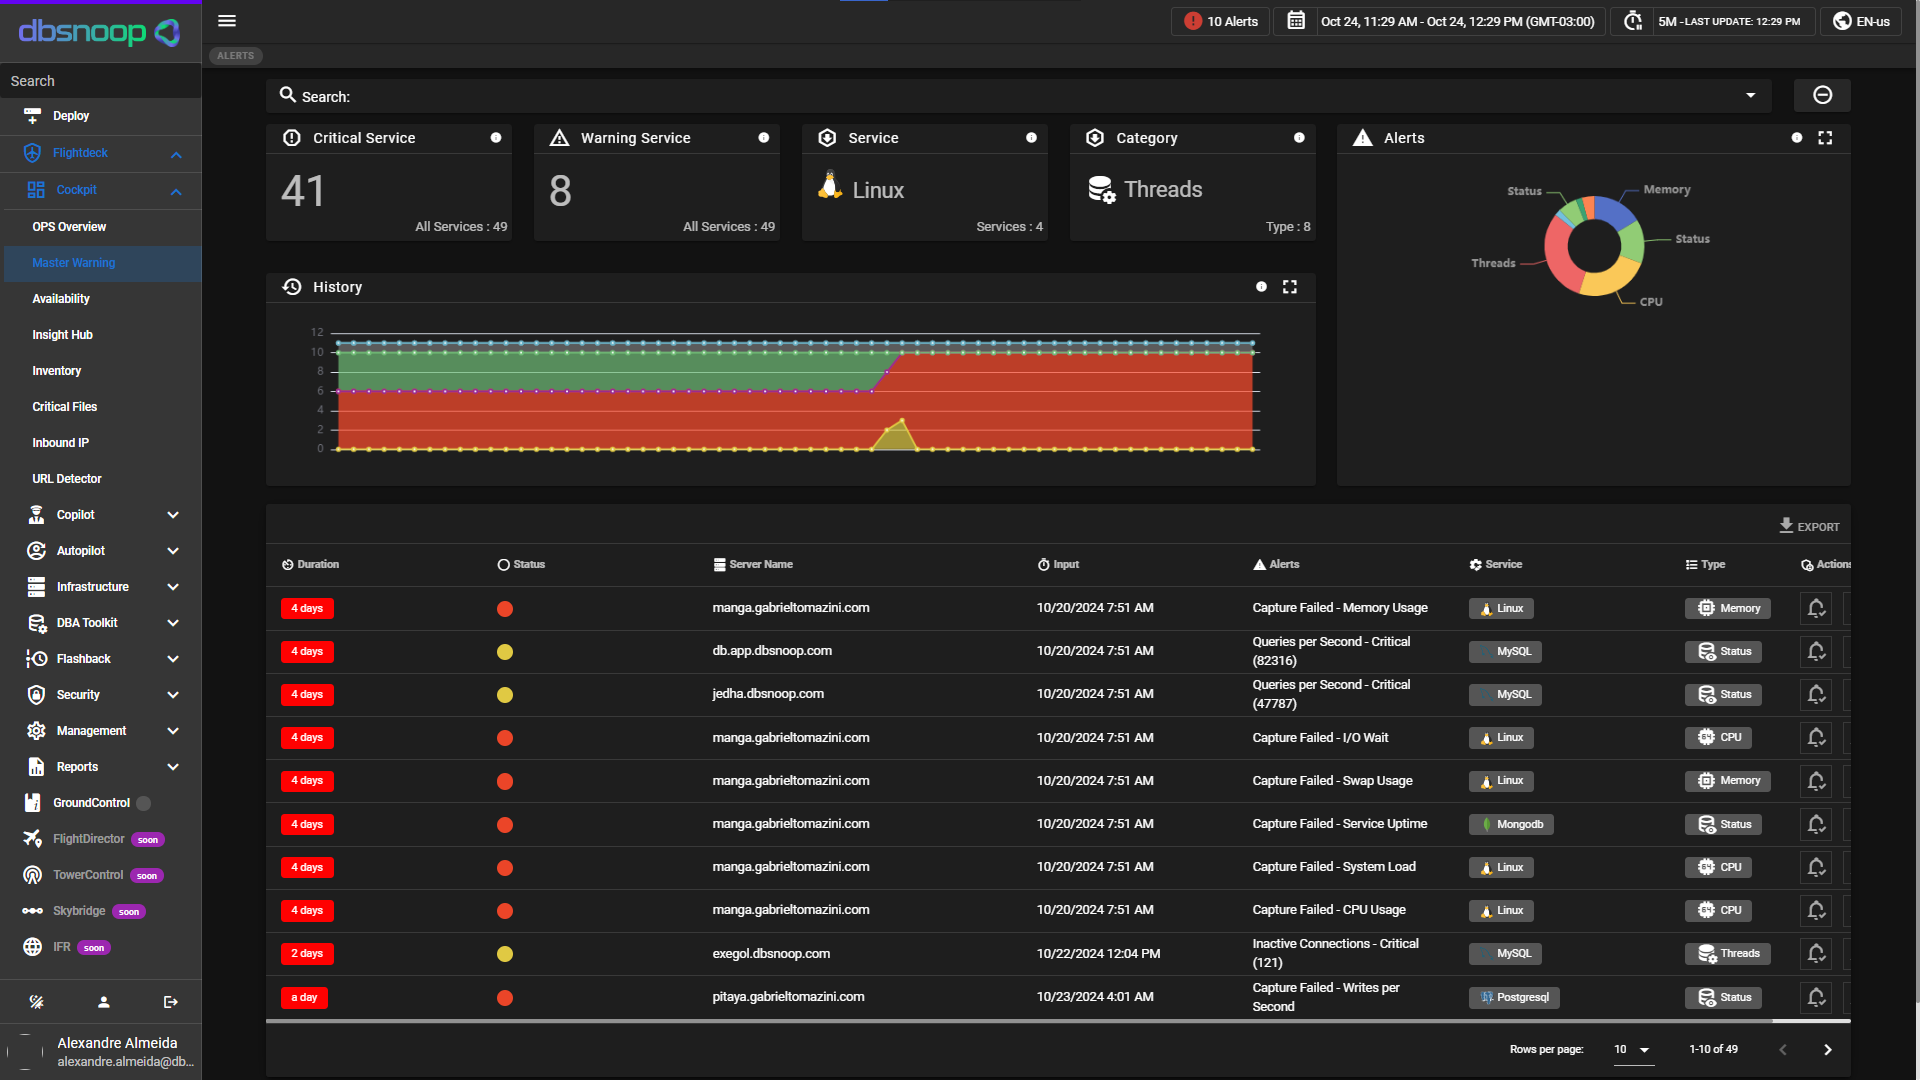
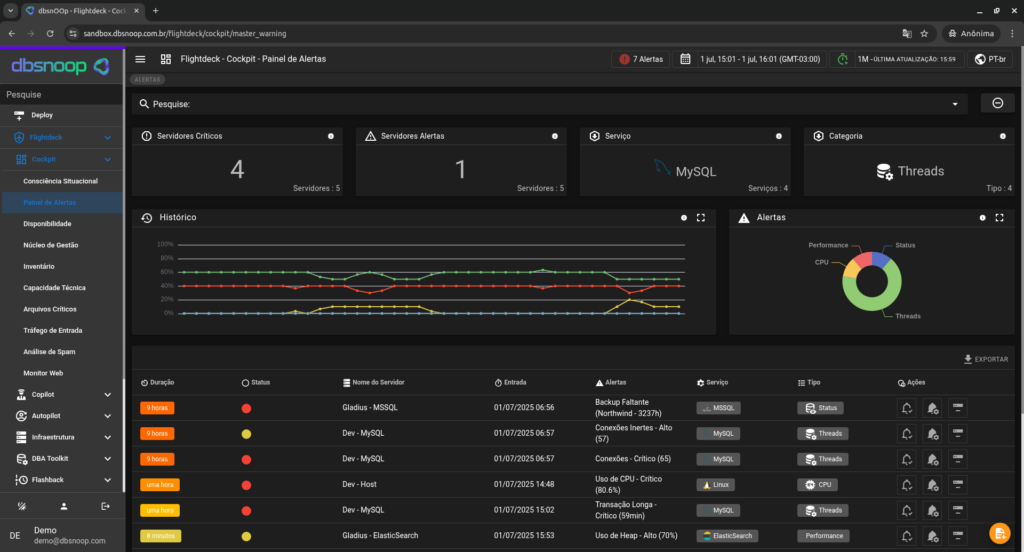
Real-time alerts and Master Warning
Receive instant alerts with intelligent prioritization, which differentiates noise from real incidents.
The Master Warning groups correlated alerts to indicate critical events with greater accuracy and reduce the team’s reaction time.
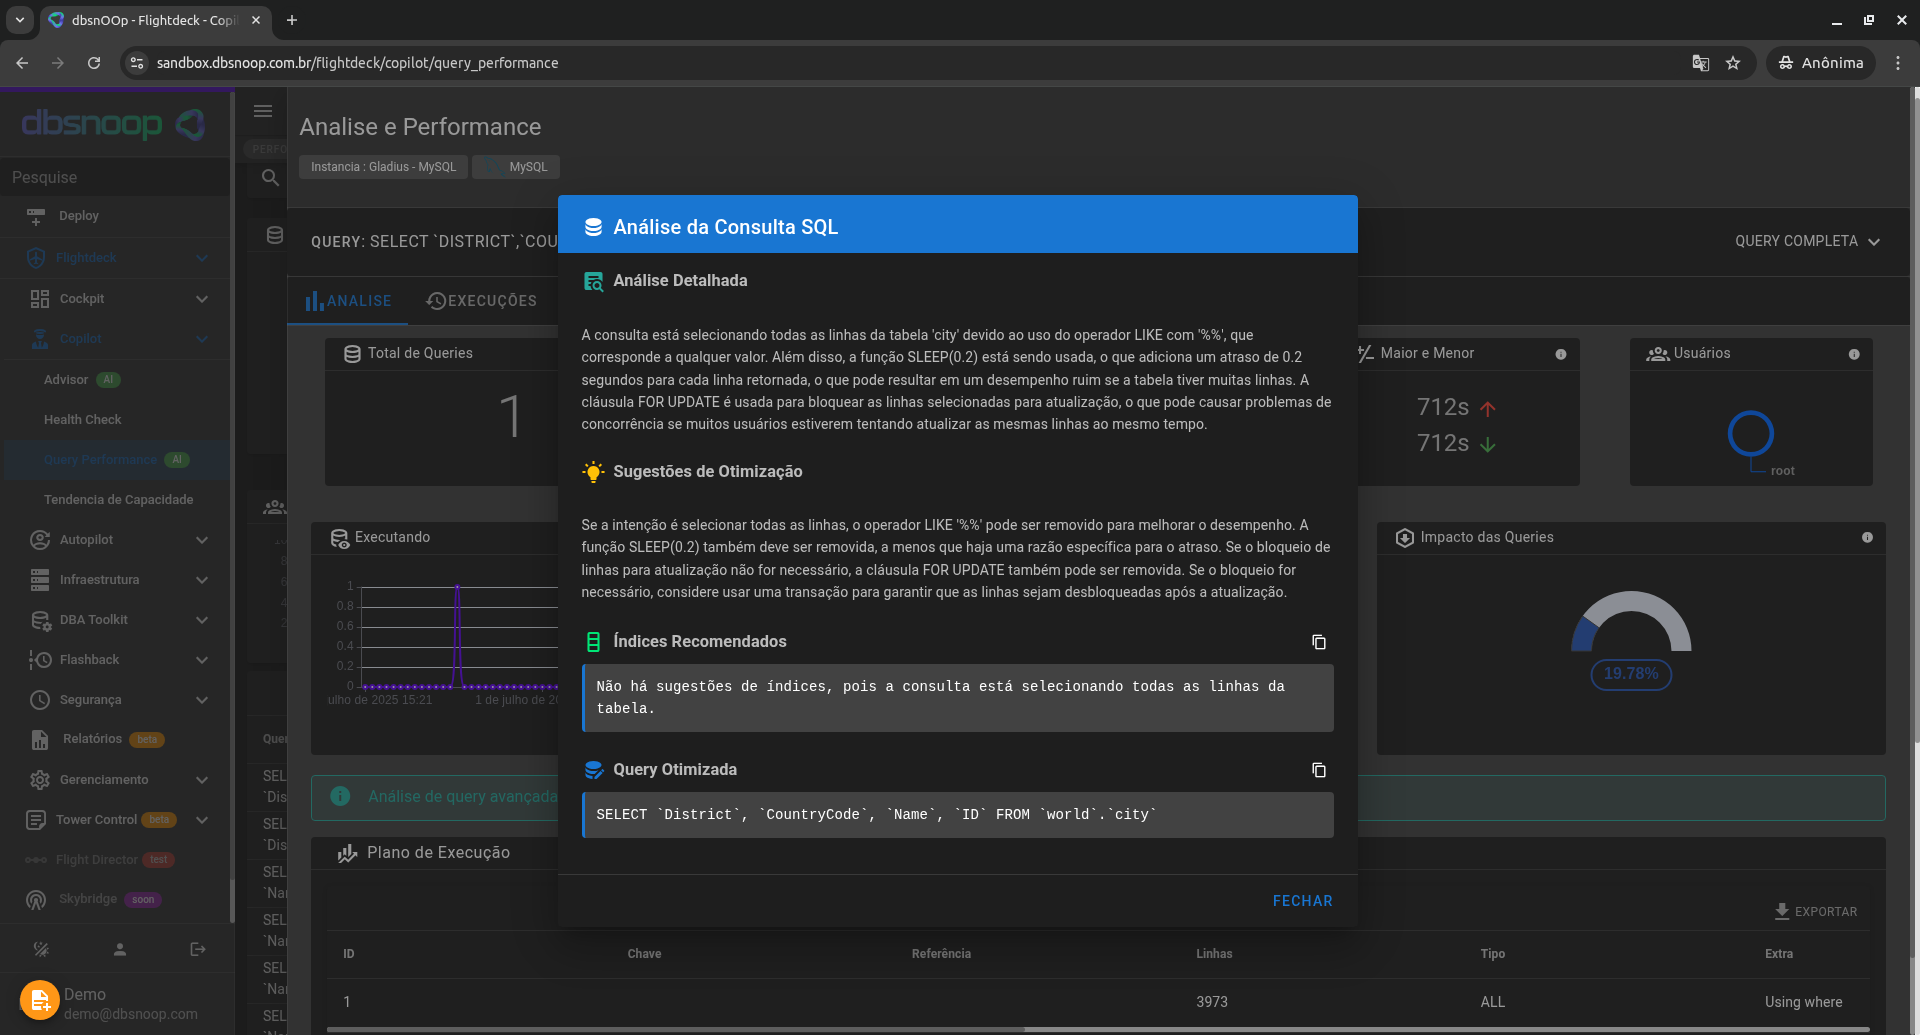
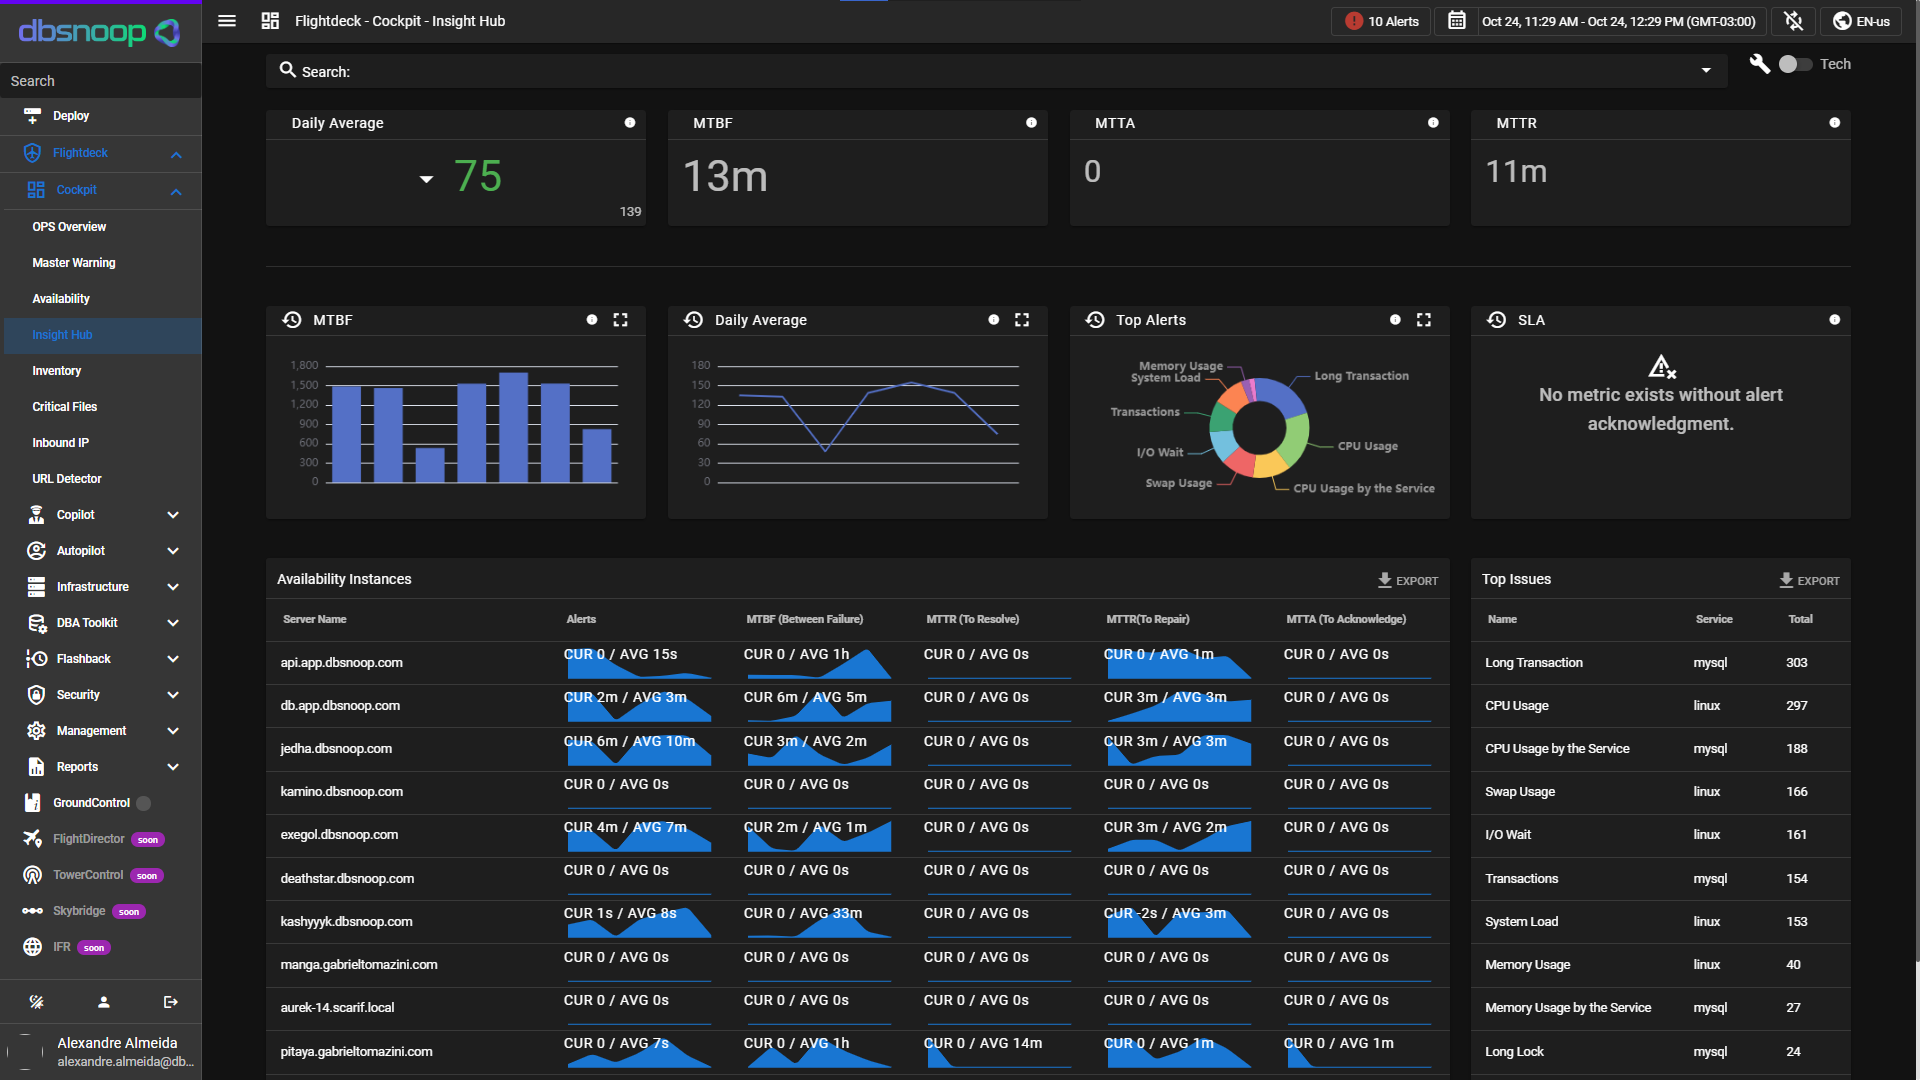
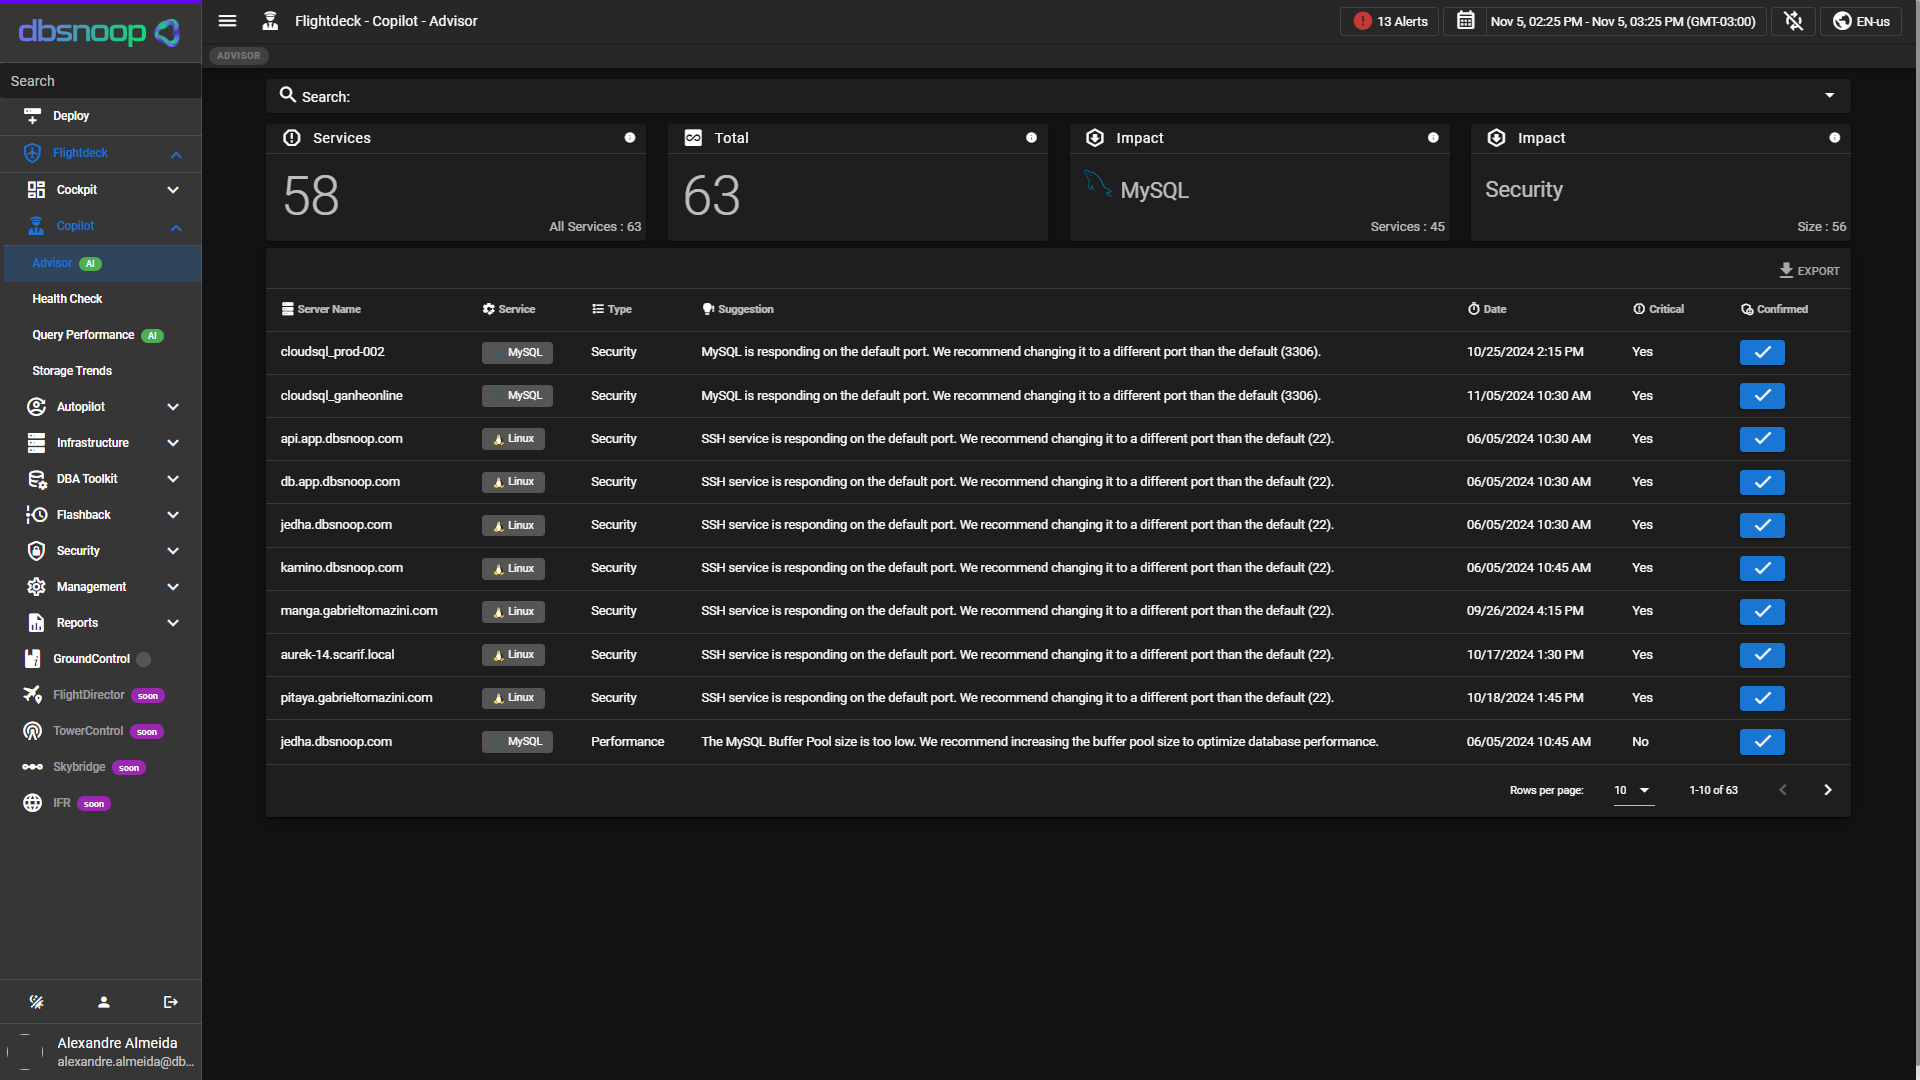
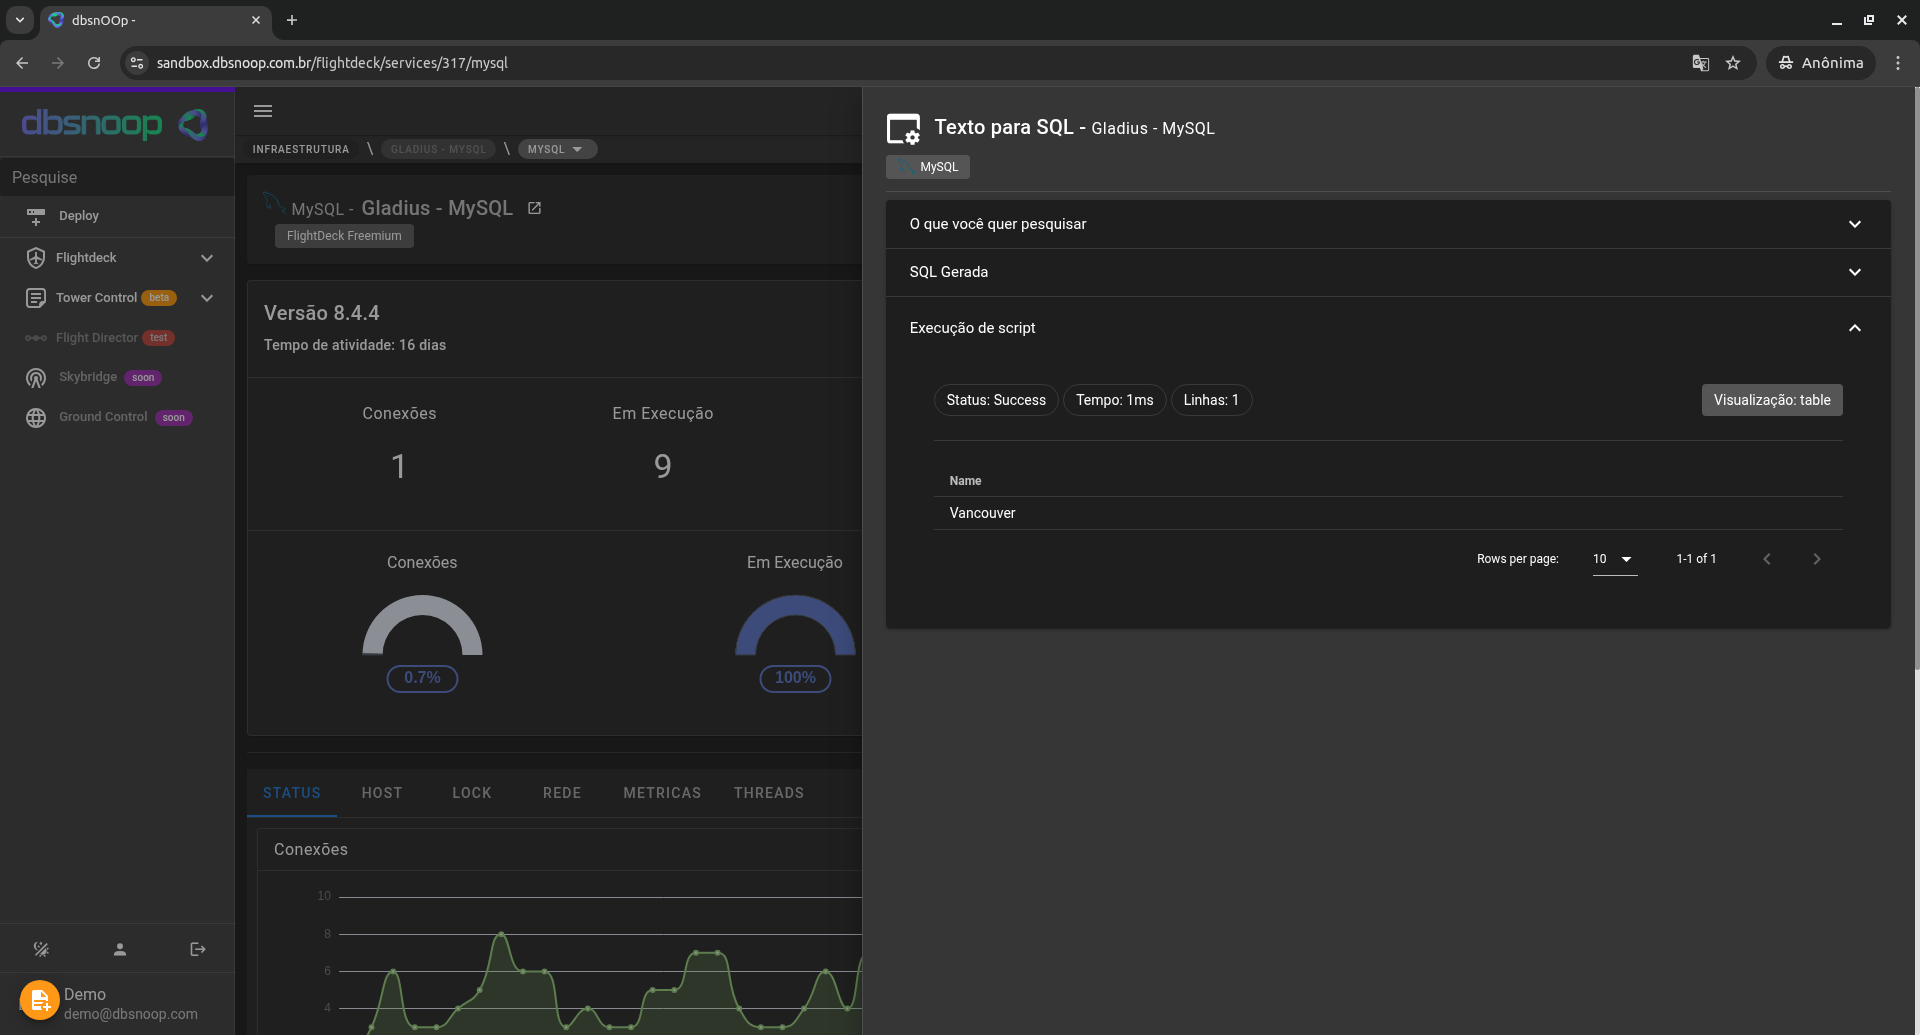
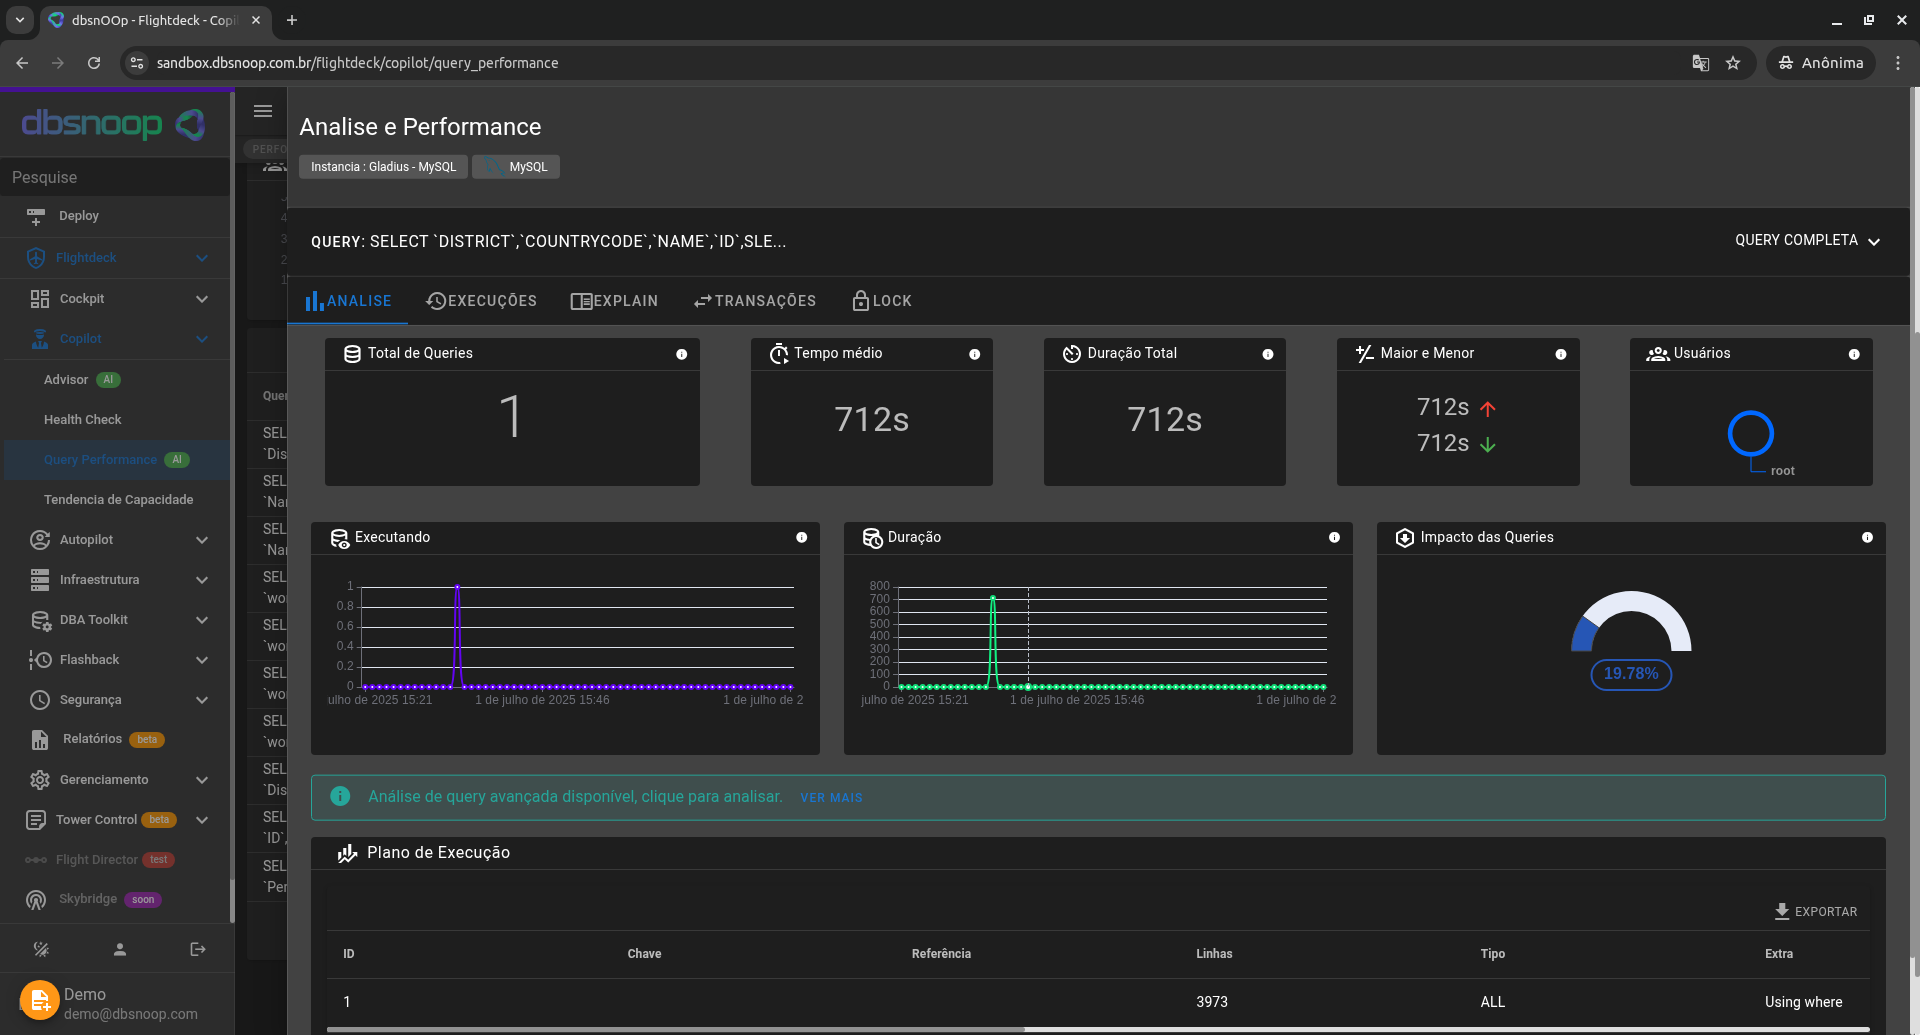
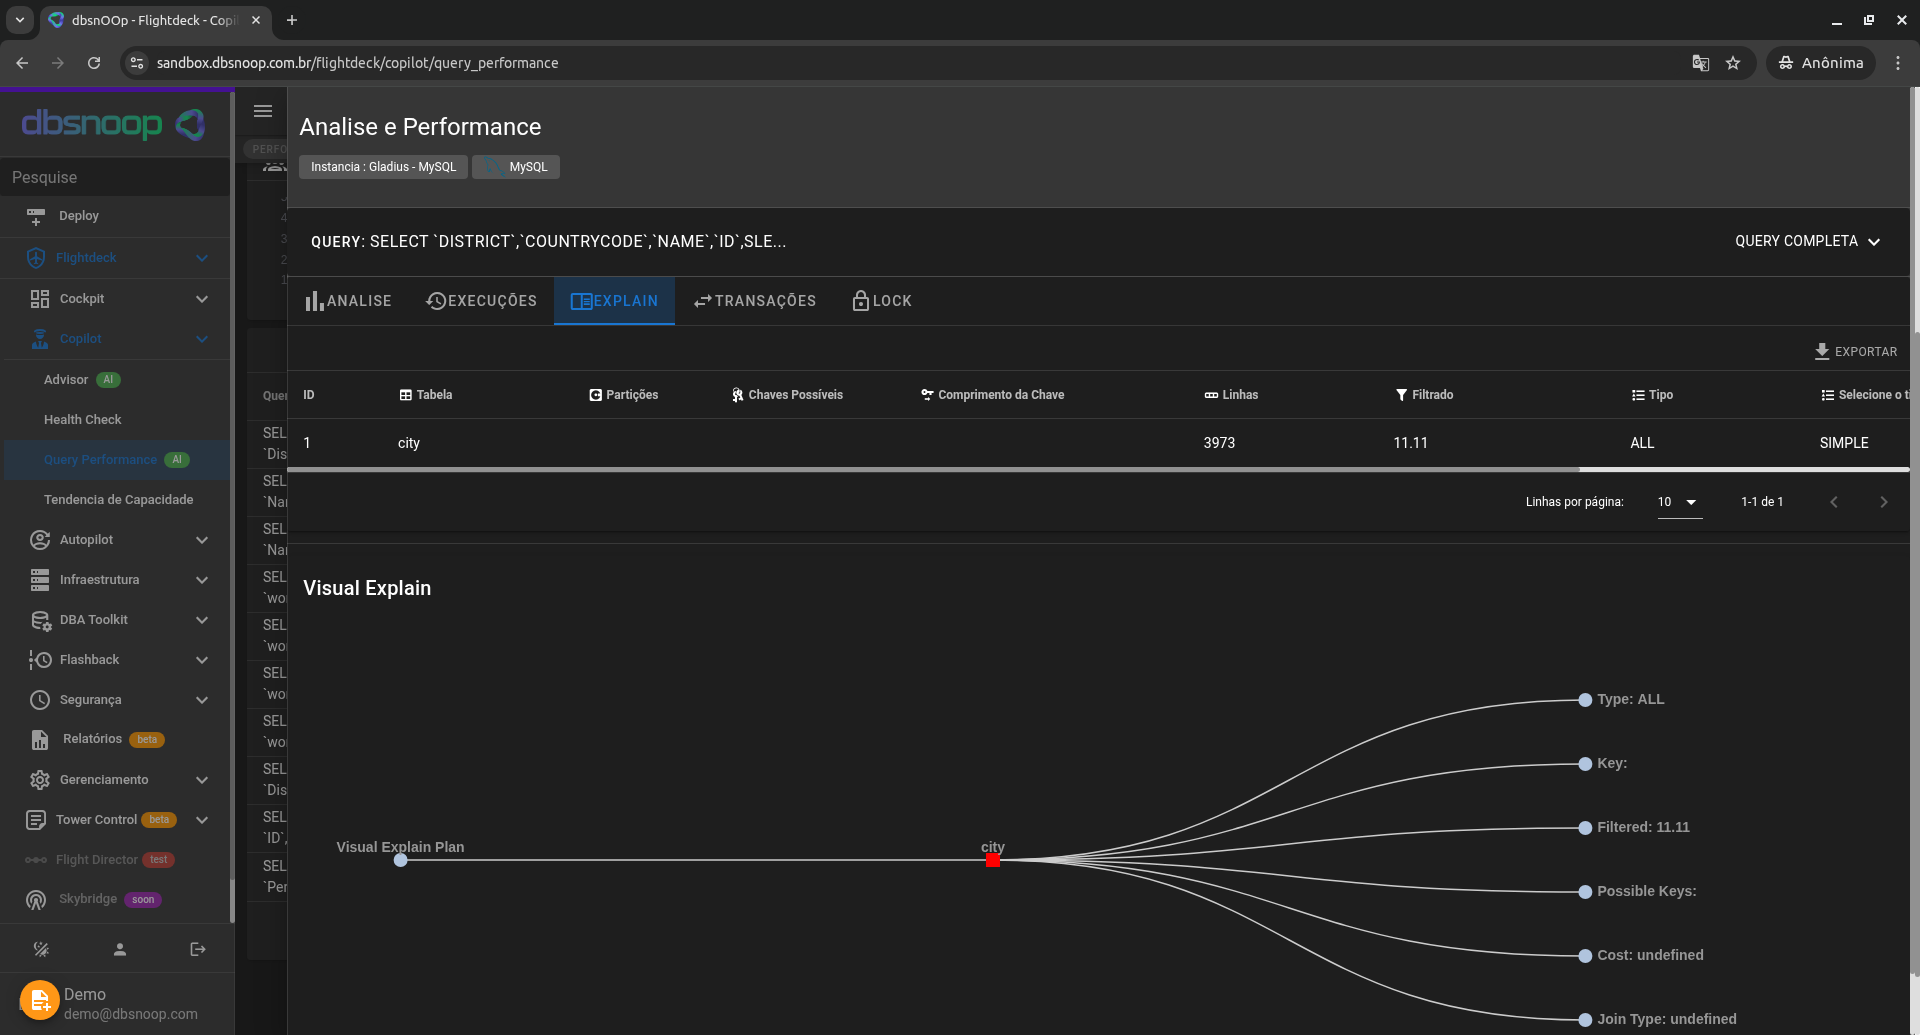
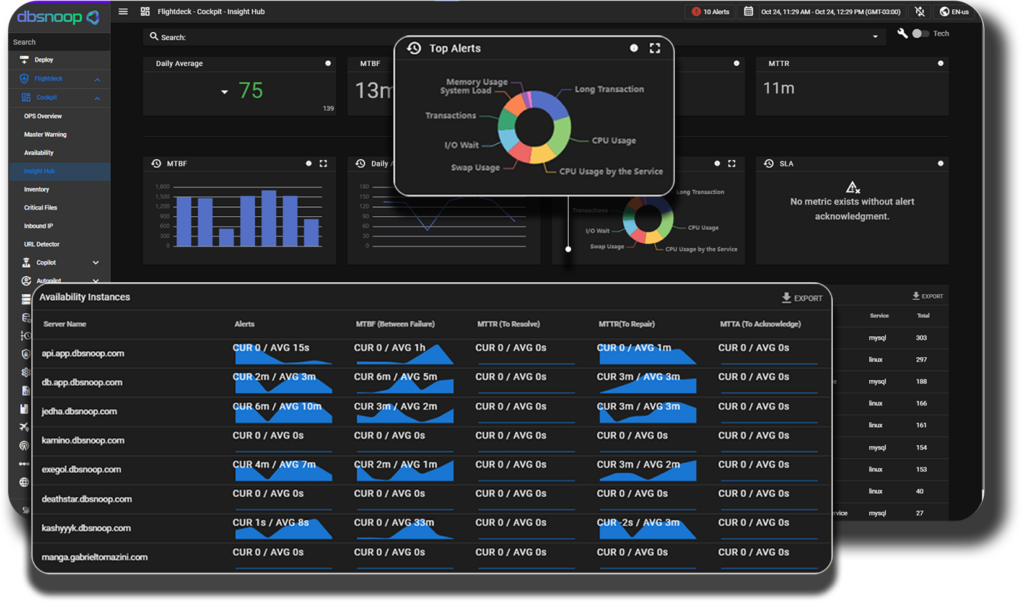
Insight Hub
Here, alerts gain technical and historical context.
The Insight Hub transforms raw metrics and events into actionable insights — showing trends, recent behavior, and possible root causes in a visual and objective way.
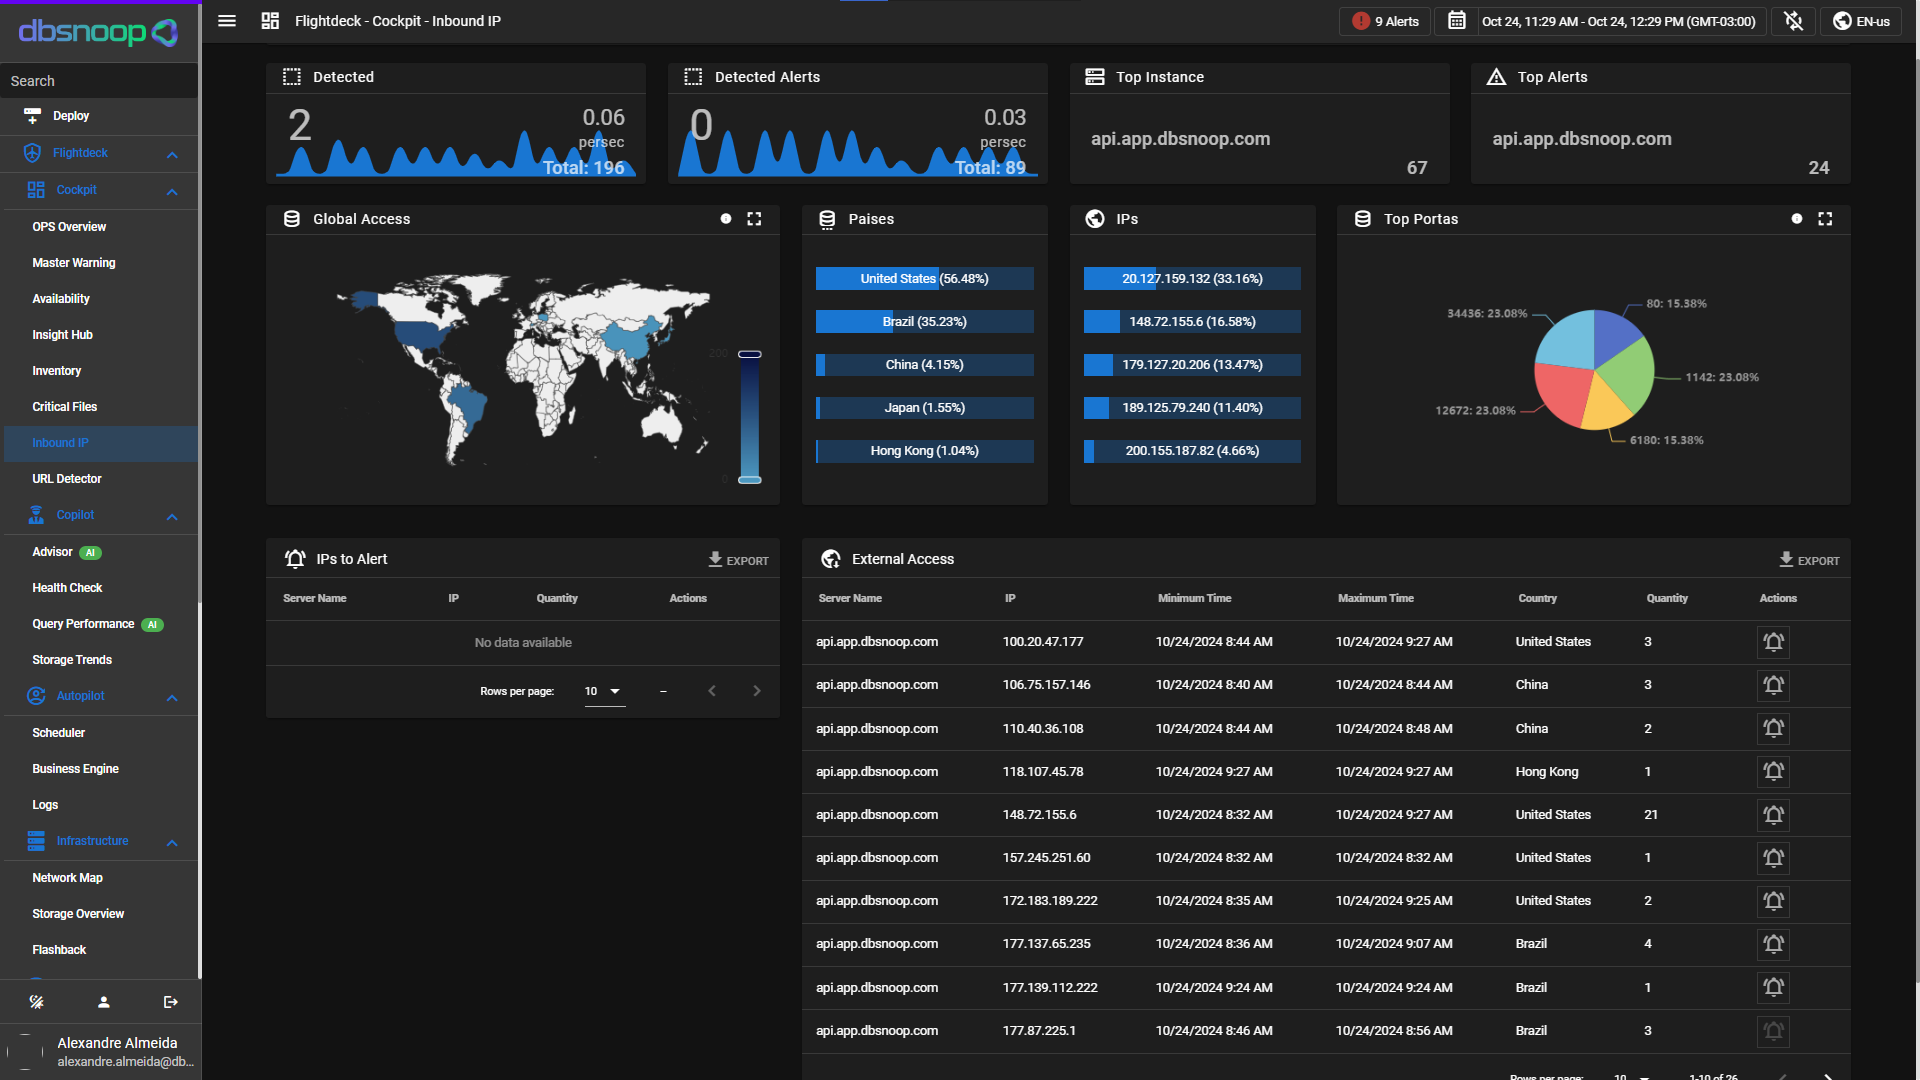
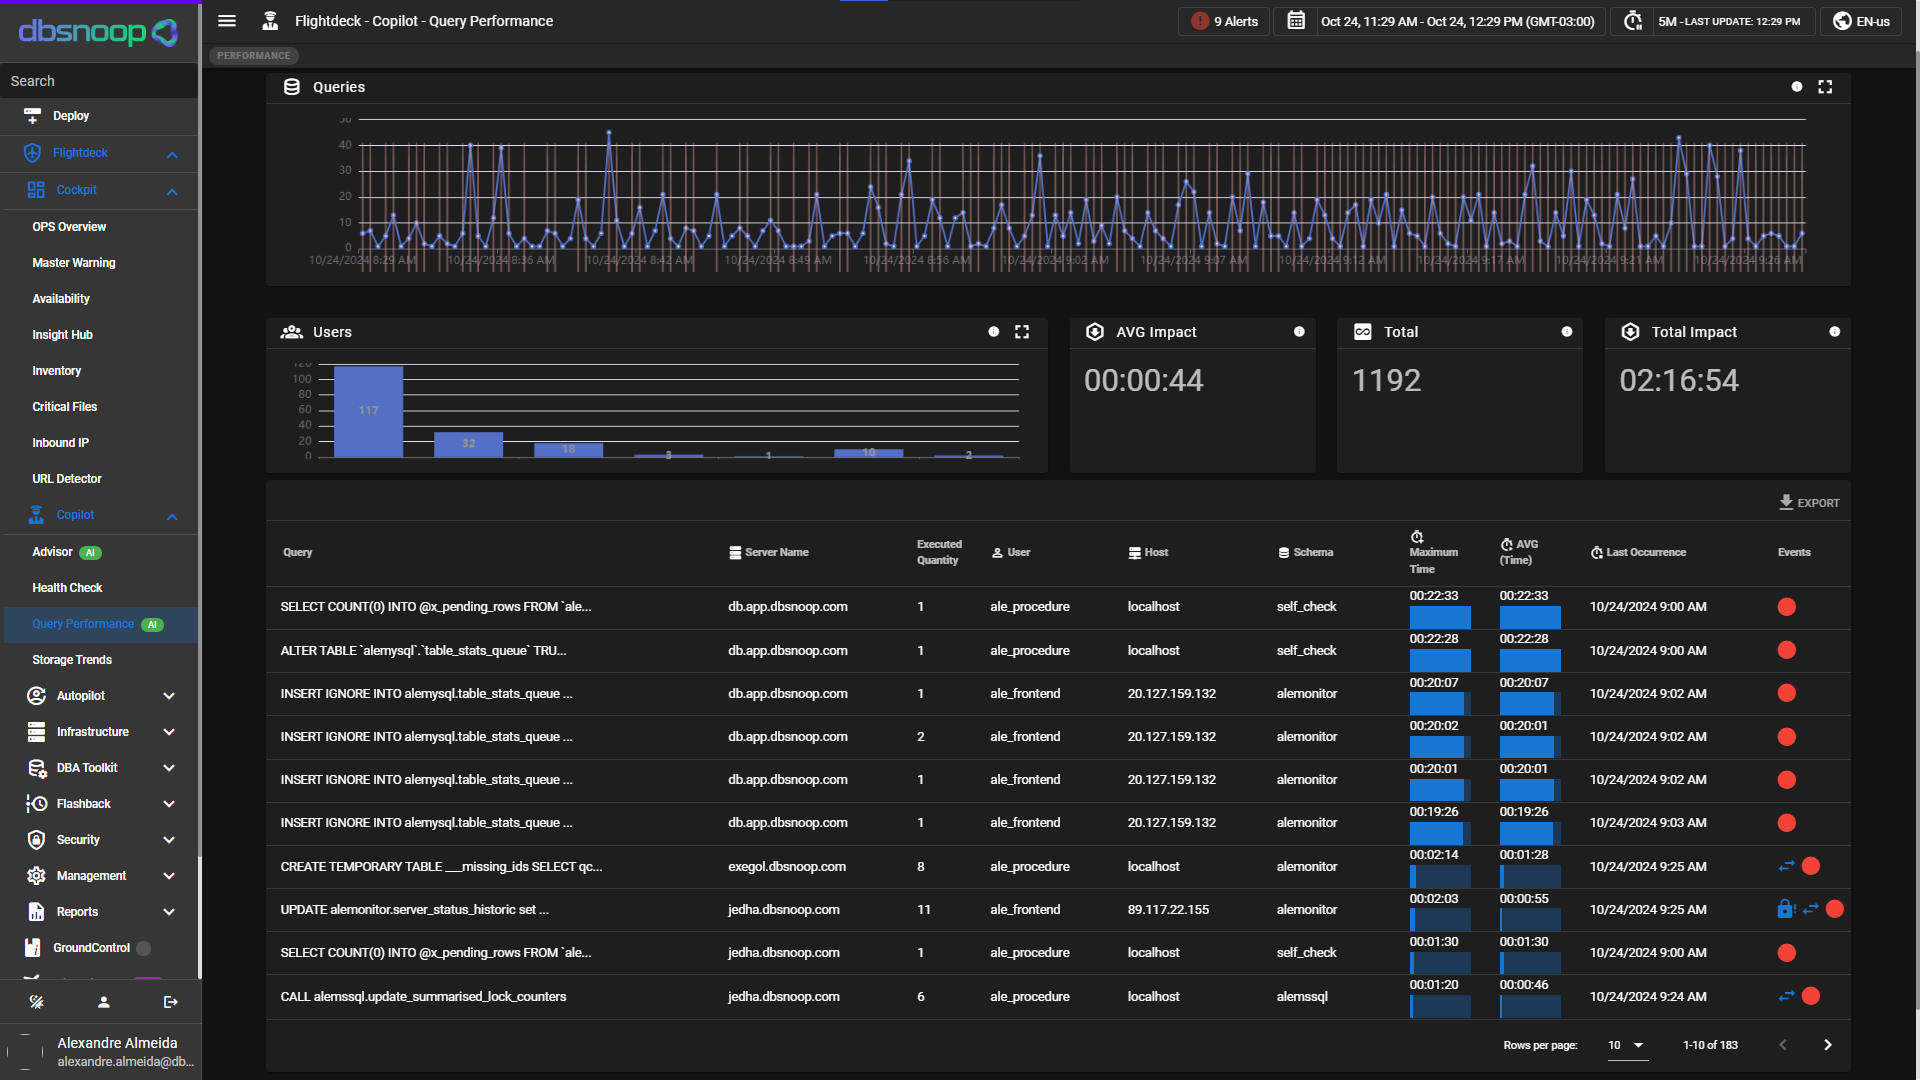
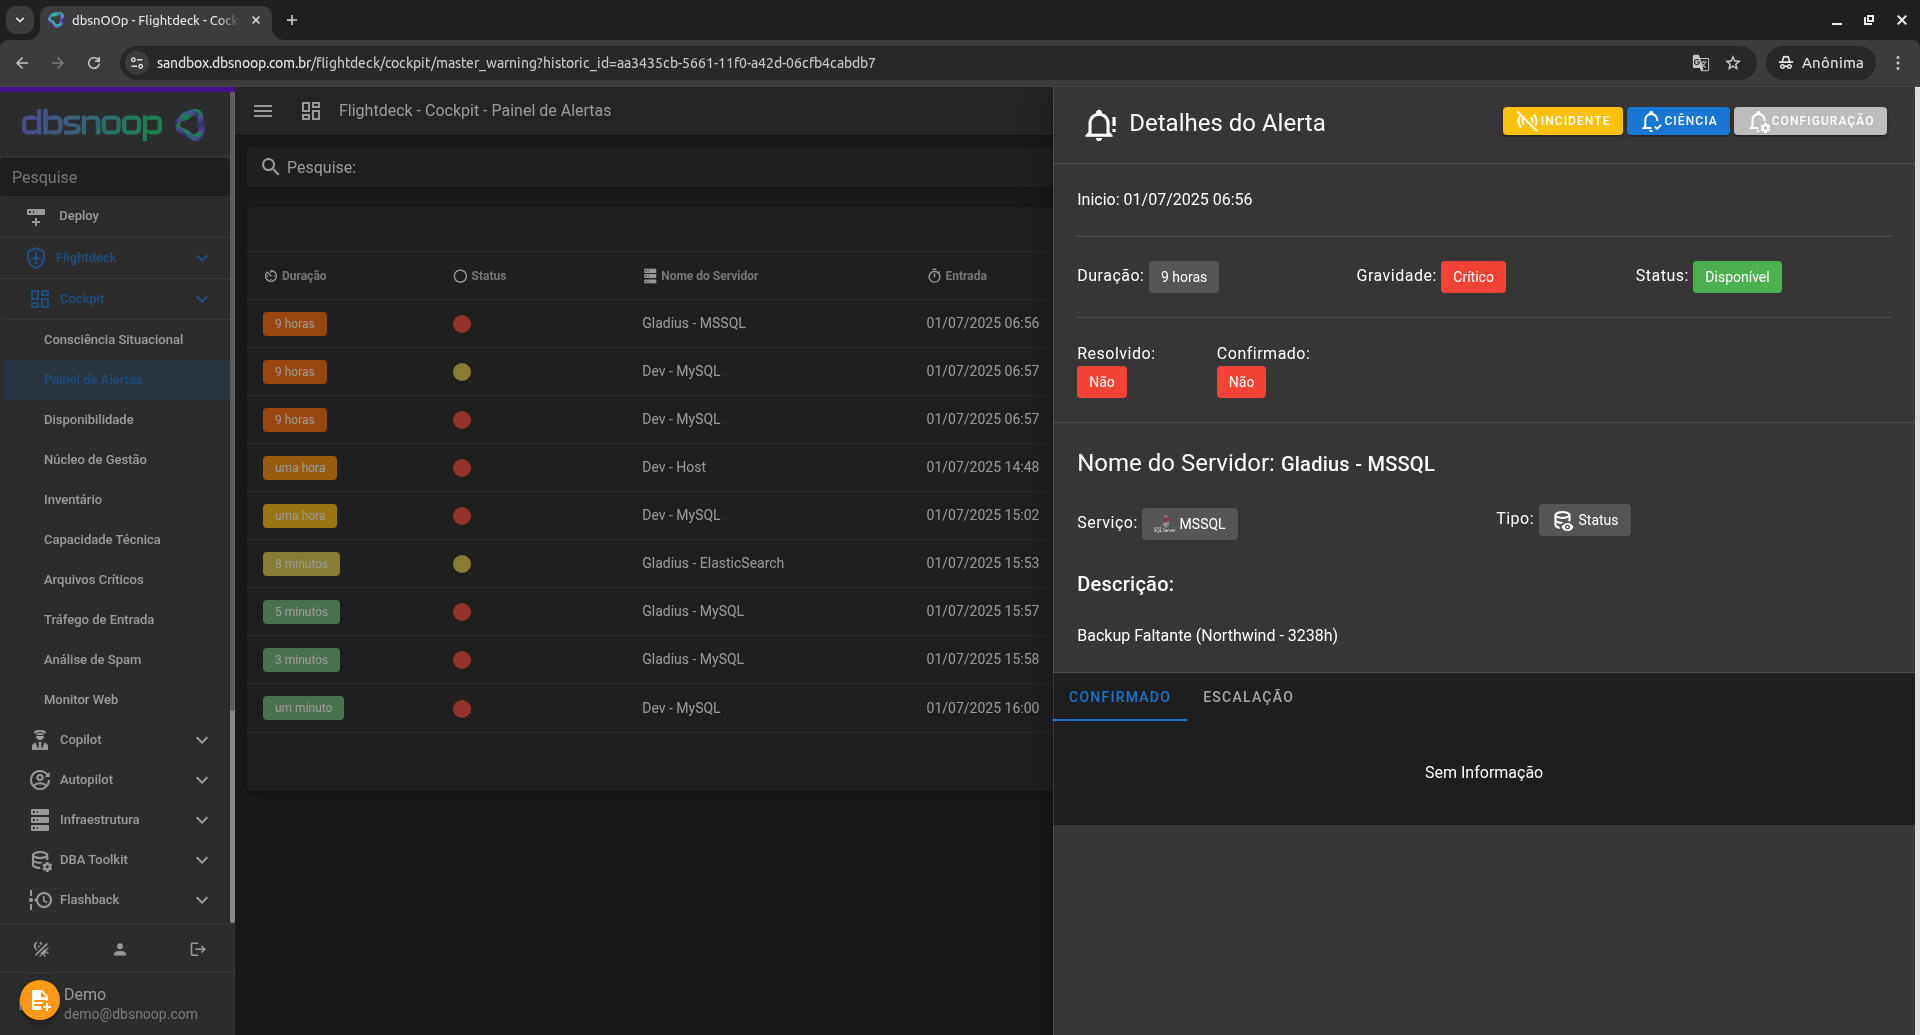
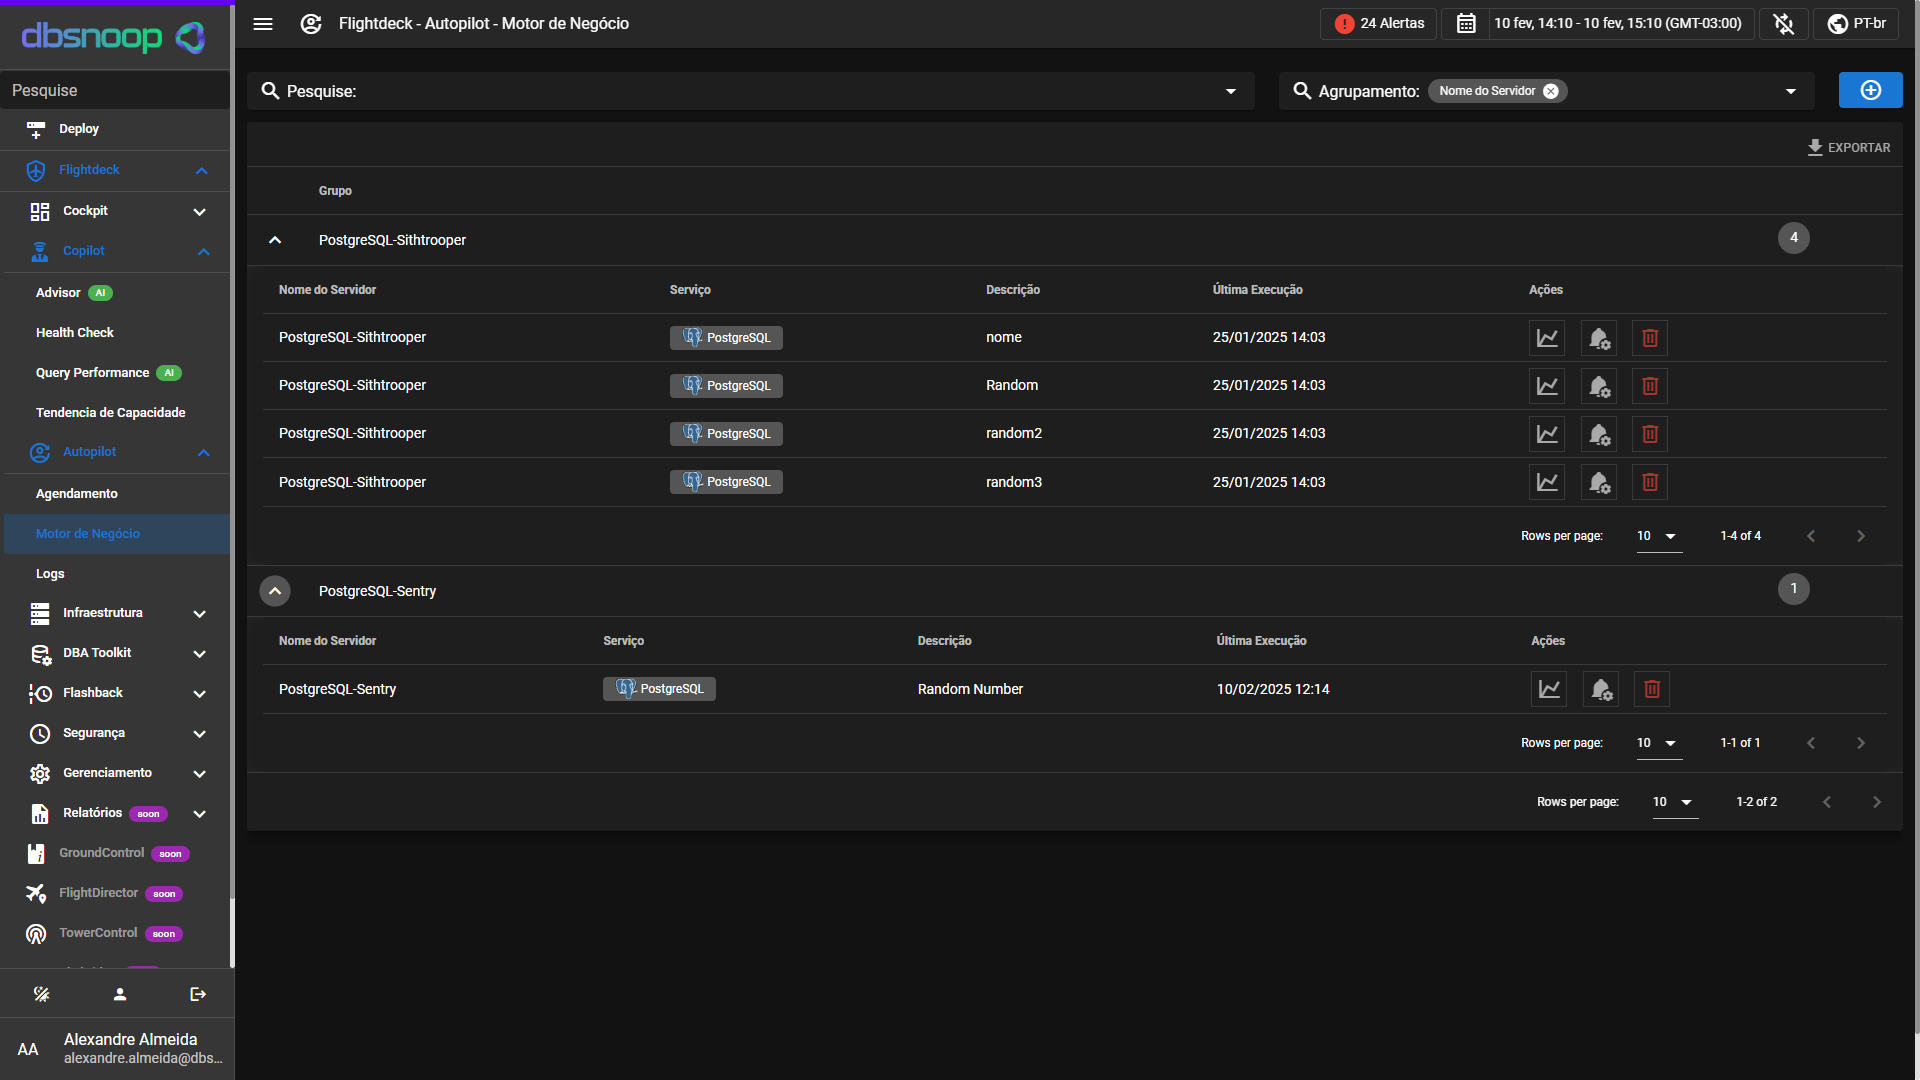
Alerts and Incidents Dashboard
Centralize everything in a single place.
Track alerts, open incidents, event history, and actions taken, with filters by criticality, technology, response time, and more.
Have complete traceability of what happened, who acted, and what was done.
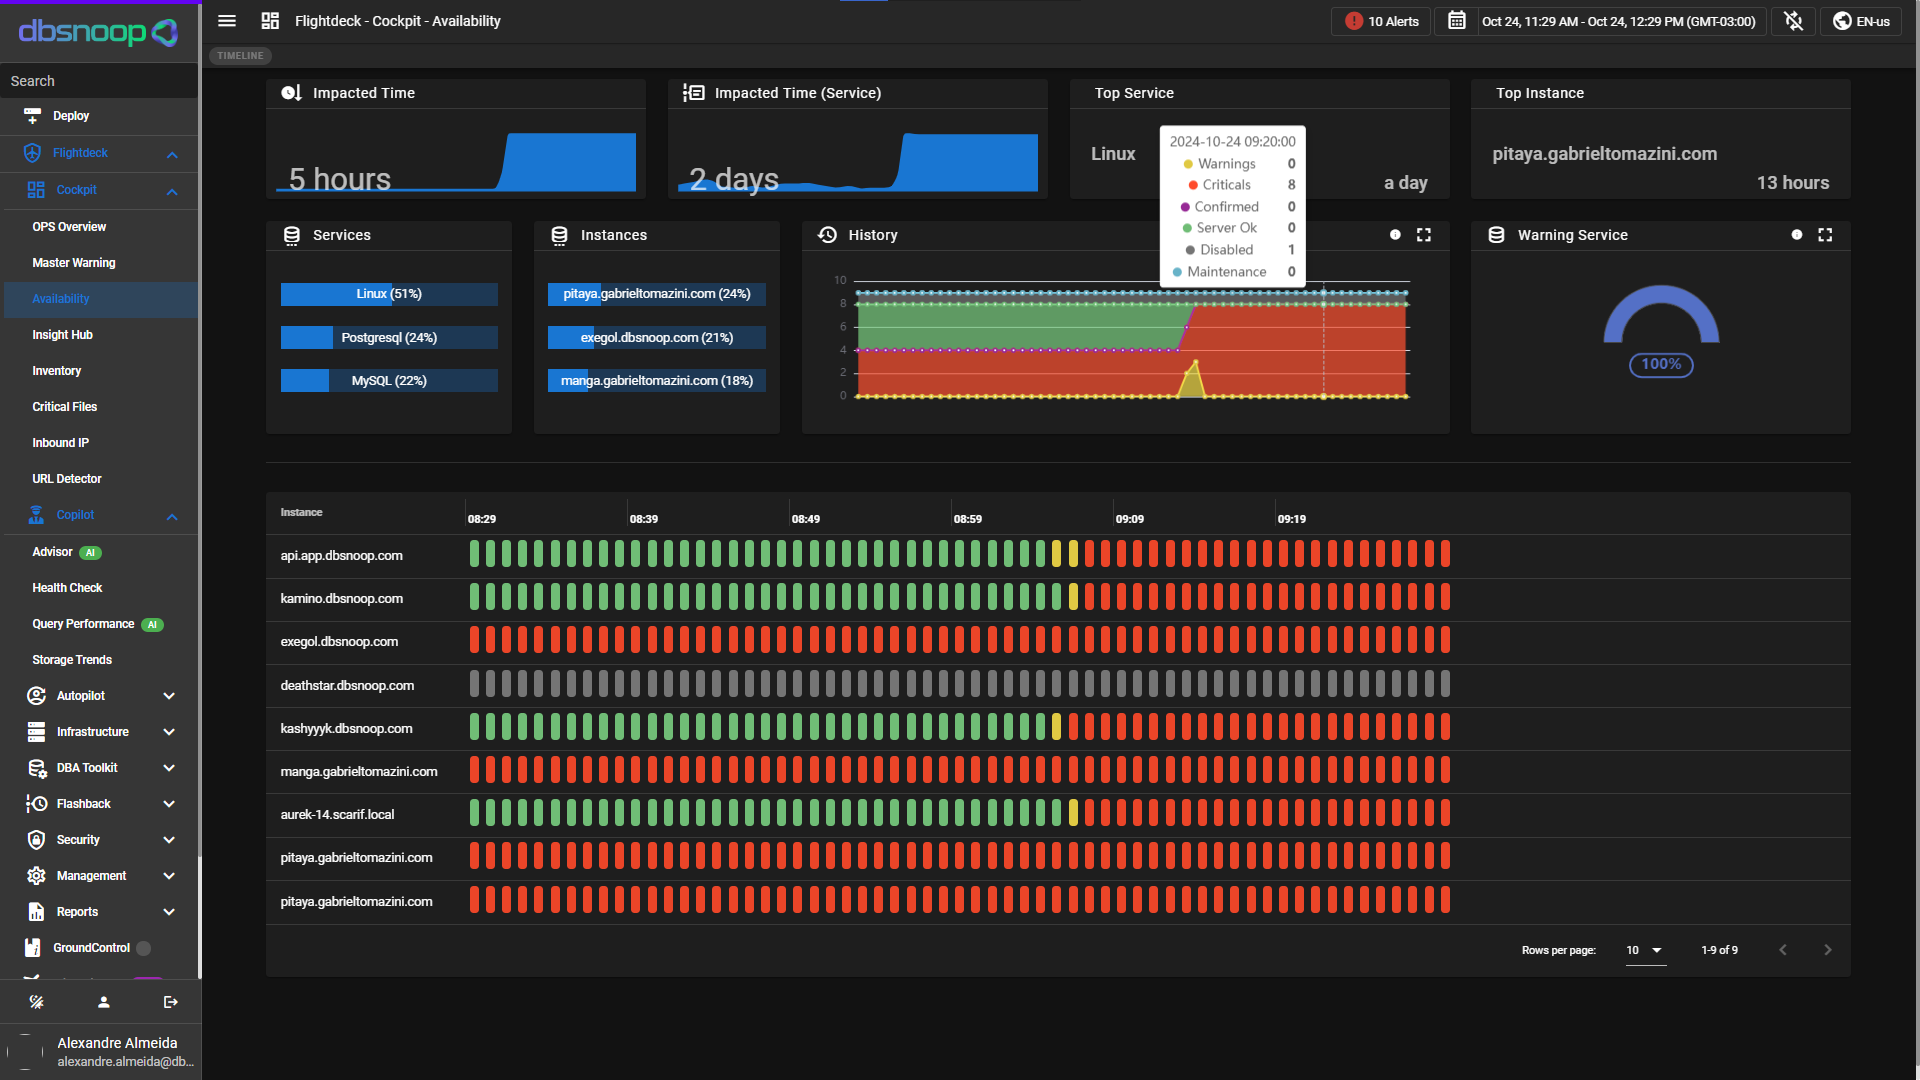
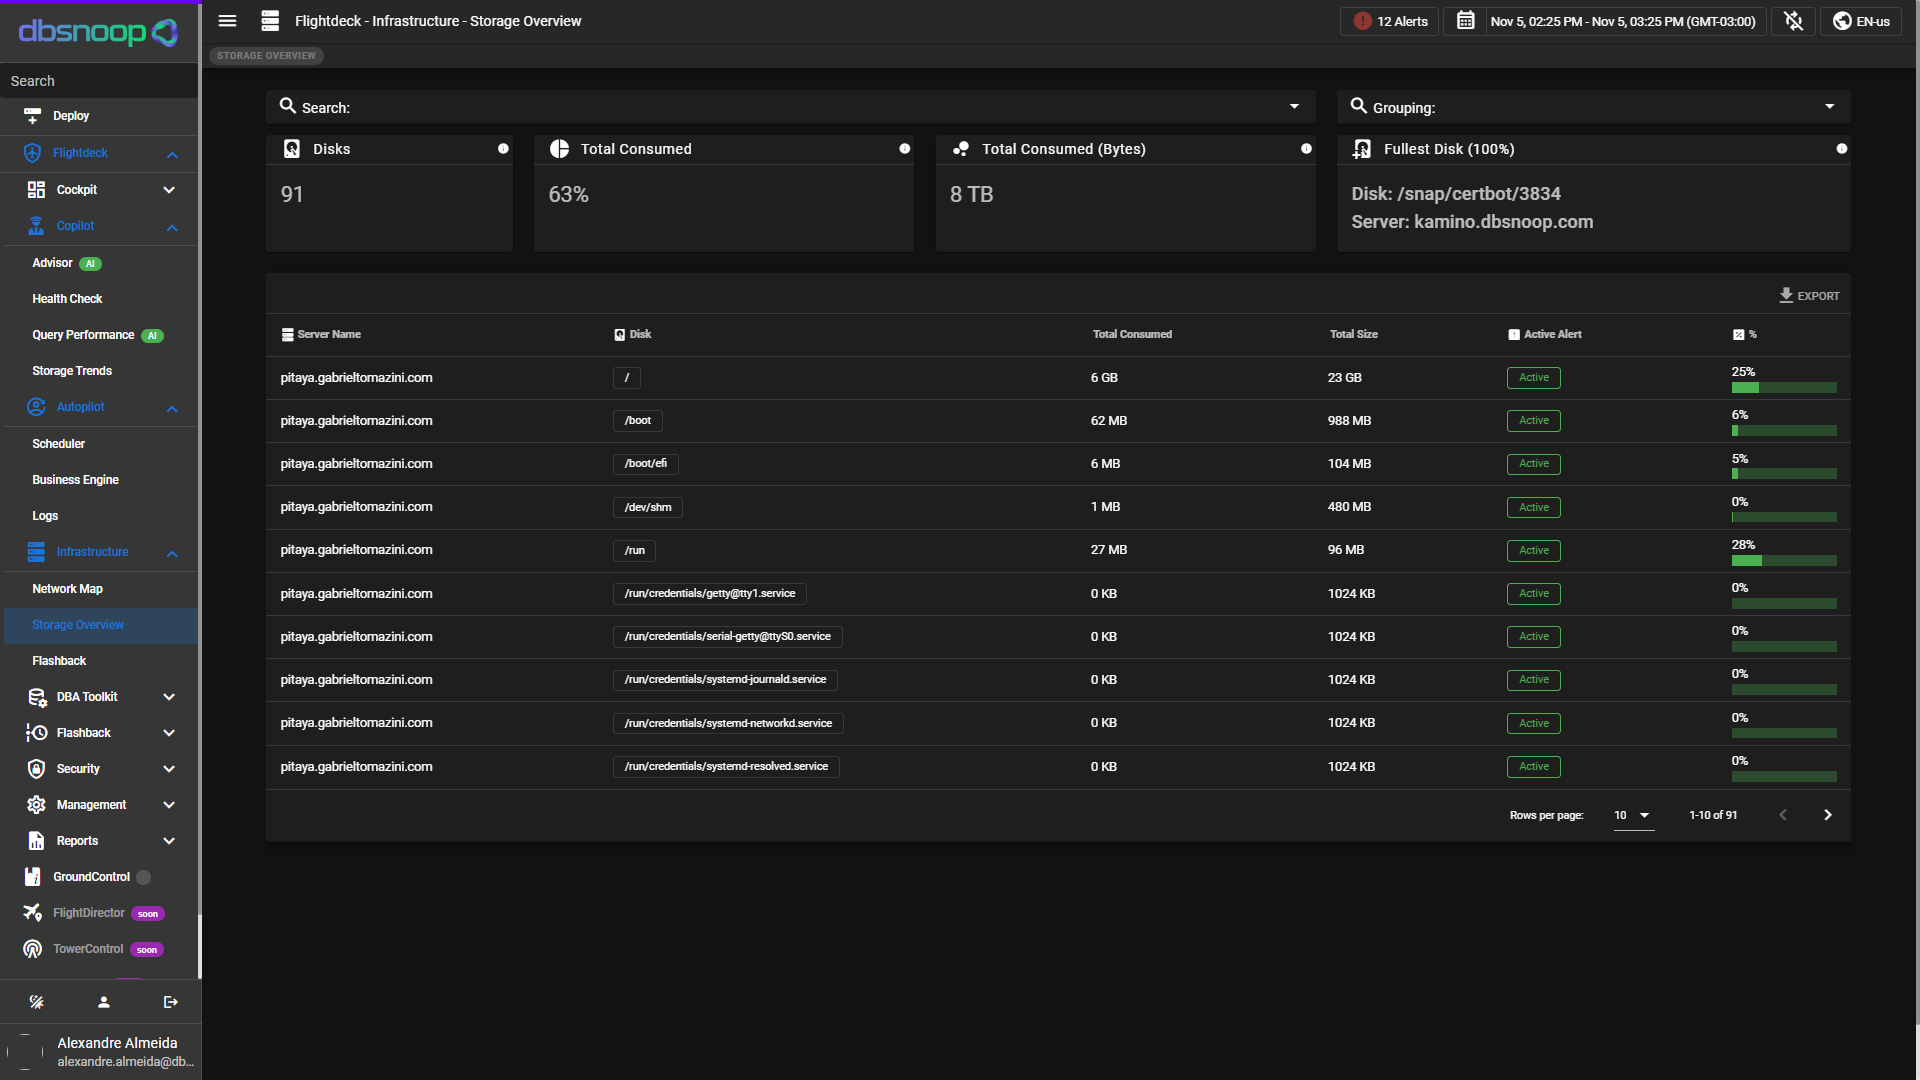
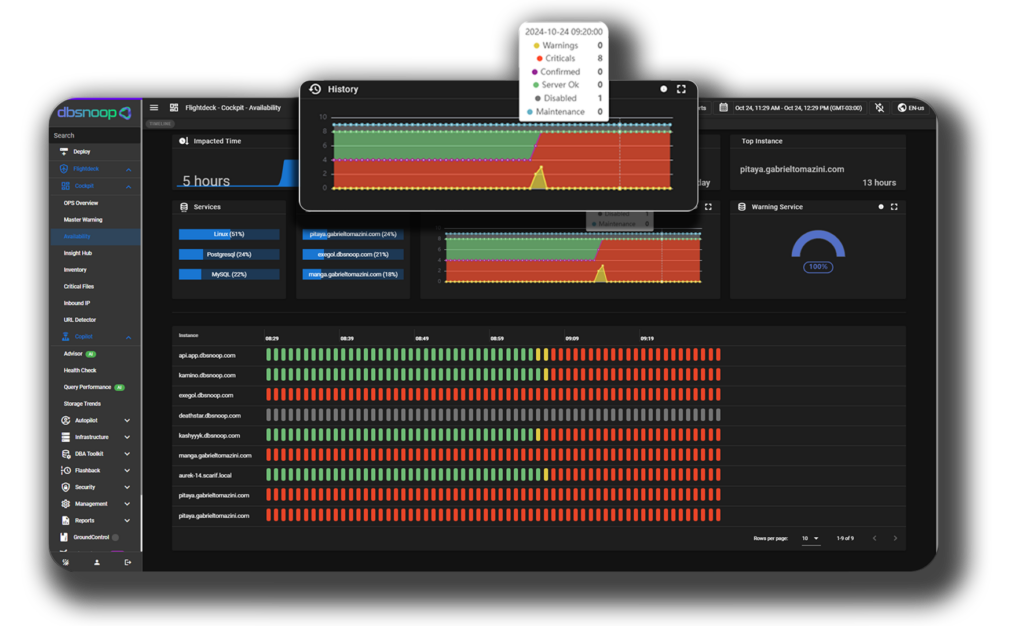
Visualize the availability timeline of your databases with precision.
The Availability Trail shows outages, intermittencies, and degradation windows — with direct correlation to registered events and impact on users and applications.
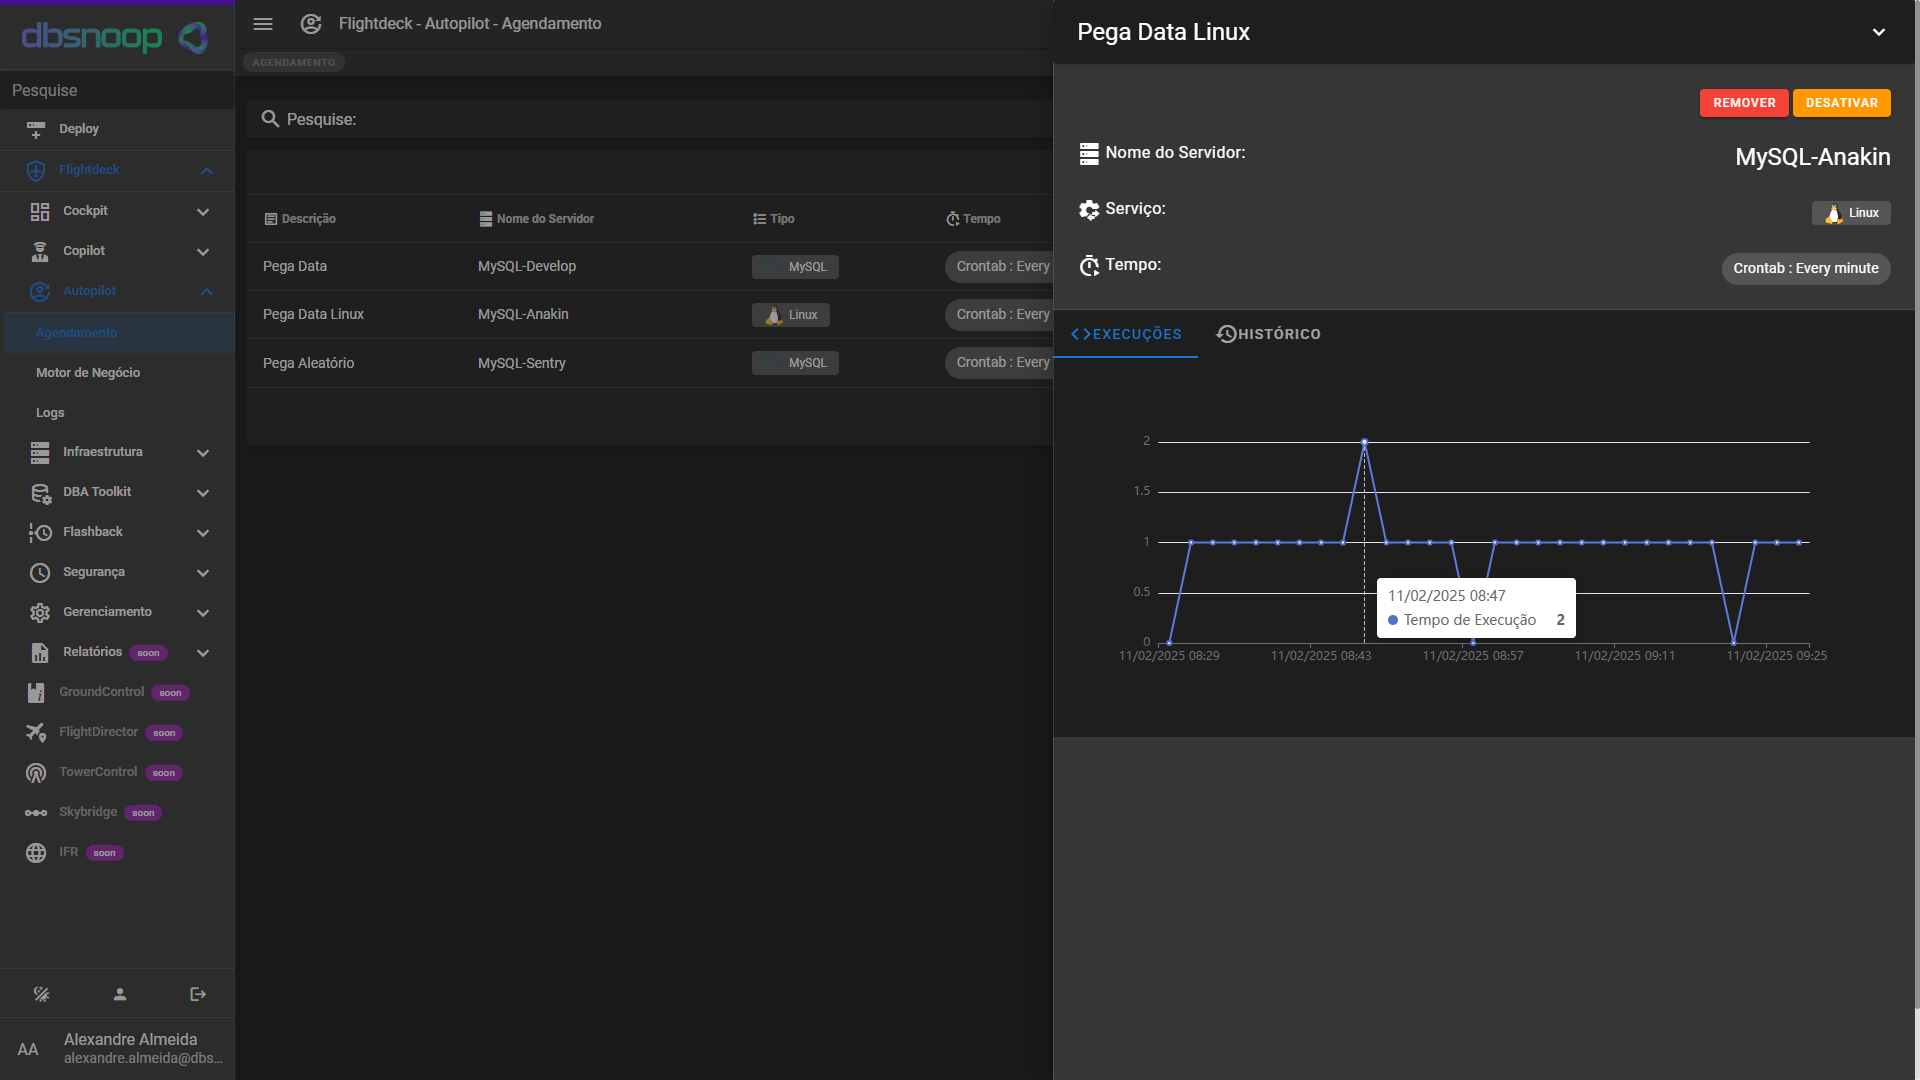
Flashback
See the past with the eyes of the present
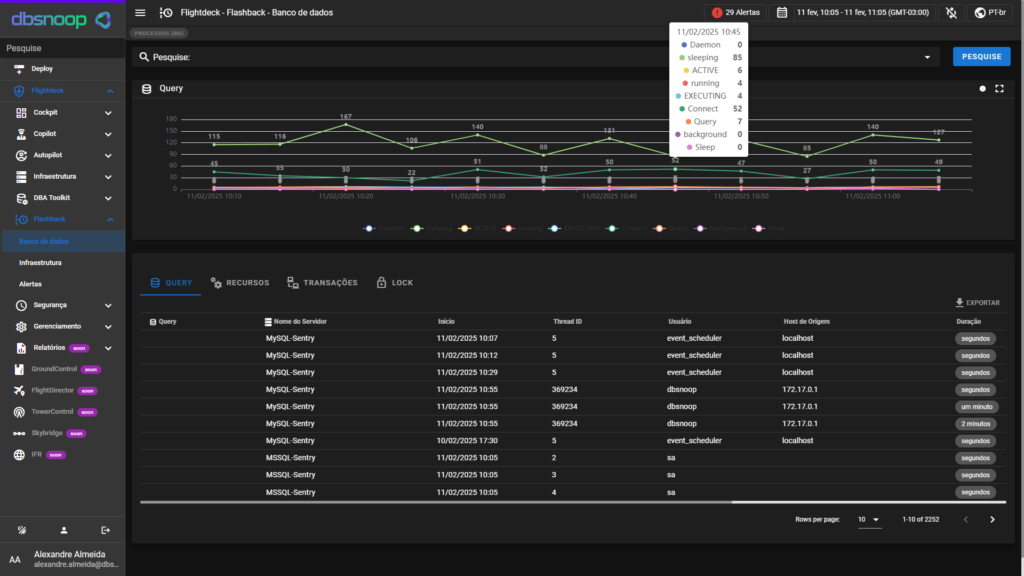
Go back in time and understand what your environment was like minutes, hours, or days before an incident.
With Flashback, you can review the complete state of telemetry, load, queries, and alerts, as if you were in that moment, allowing for detailed forensic analysis.
DBSNOOP DELIVERS MORE THAN DATA
It gives you the confidence of knowing what’s happening. Before someone even opens a ticket.